
Tree cover deficit
Greenery
Supports greening plans by showing canopy/greenness shortfall citywide, not only in a few priority districts.
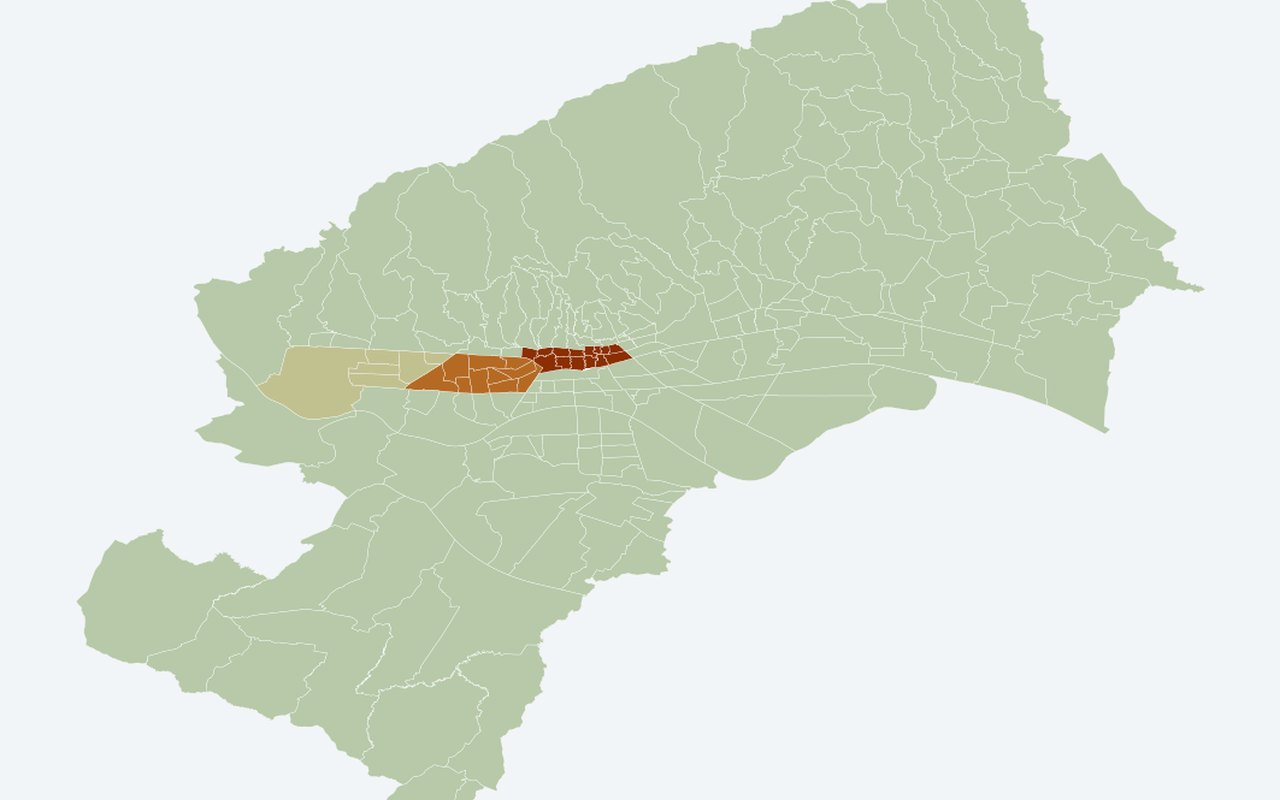
What it shows
Shows where neighbourhoods lack vegetation greenness relative to a realistic greening target (Stenjevec-style NDVI 0.422), mapped for all 218 mjesni odbori.
Data sources
District mean summer NDVI from the Landsat sample (latest summer summary), joined to all Census 2021 neighbourhood polygons. Target NDVI = 0.422 (RQ-C realistic benchmark).
How it was prepared
For each neighbourhood, deficit_pct = max(0, 0.422 − district_mean_NDVI) × 100. Every neighbourhood in a district inherits that district’s NDVI.
Interpretation limits
NDVI is district-level, not MO-level. Zero deficit means at or above the target, not “no heat.”