
Where Zagreb runs hottest — and who lives there
In summer 2026 — the most recent measured summer — Zagreb’s dense inner districts ran 6 to 8 °C hotter at the land surface than the green periphery, and every one of the 218 neighbourhoods went through at least a week of heatwave conditions. The hottest areas overlap almost exactly with where the most people live, where the oldest residents are concentrated, and where several busy outdoor markets sit.
+6.2 °C mean heat-island intensity 5 districts above the hot threshold 6 city-wide heatwaves −0.79 greener pixels are cooler 67% of residents struggle with hot weather
Main finding
Five districts stand out in 2026: Trešnjevka – sjever (+8.3 °C), Donji Grad (+8.1 °C), Novi Zagreb – istok (+6.7 °C), Trnje (+6.5 °C) and Peščenica – Žitnjak (+5.8 °C). Trešnjevka – sjever overtook Donji Grad this summer, and Peščenica – Žitnjak replaced Stenjevec in the top five.
The neighbourhood-level analysis below — the 32 areas that combine extreme heat with extreme density, the vulnerability index, facilities, tree deficit and refuge access — is the 2025 run, which has not been repeated for 2026. Twelve of those 32 are in Donji Grad alone, which also has the highest shares of residents aged 65+ in some areas (over 40%).
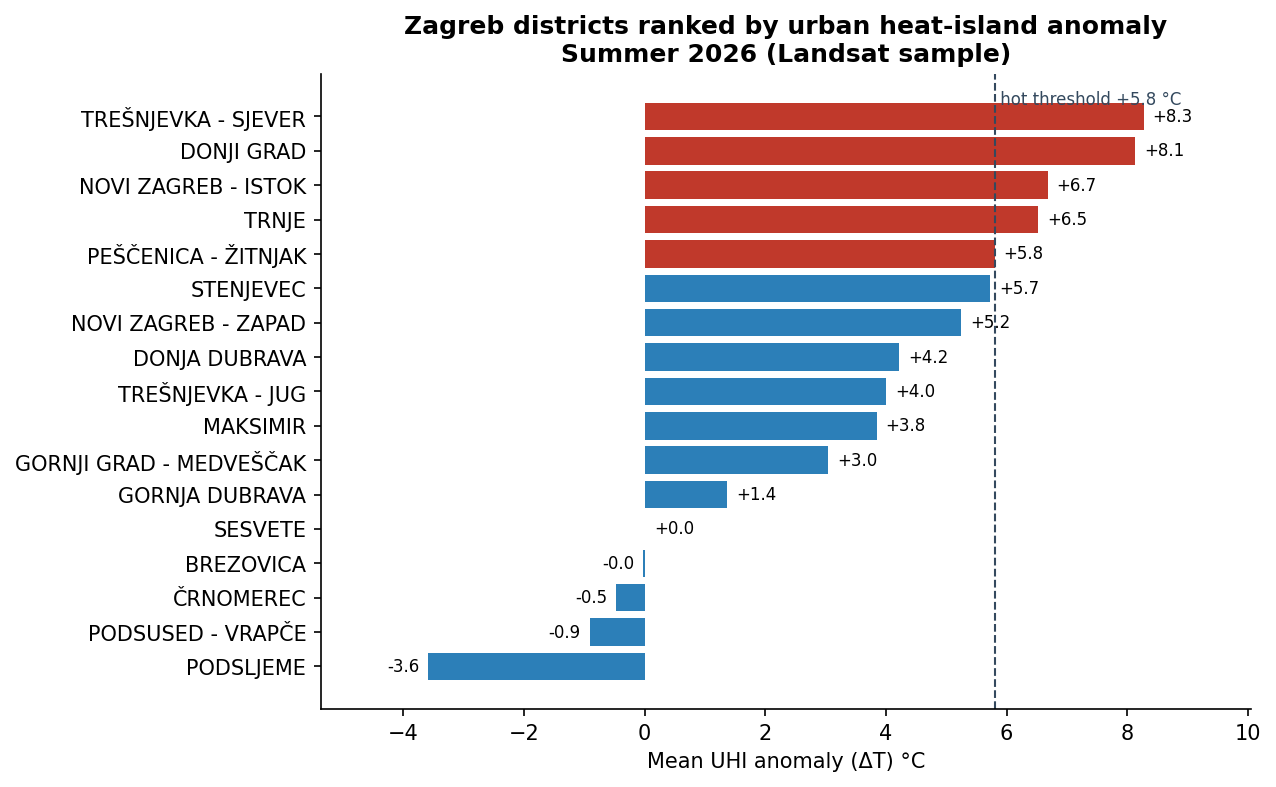 Open full-size chart
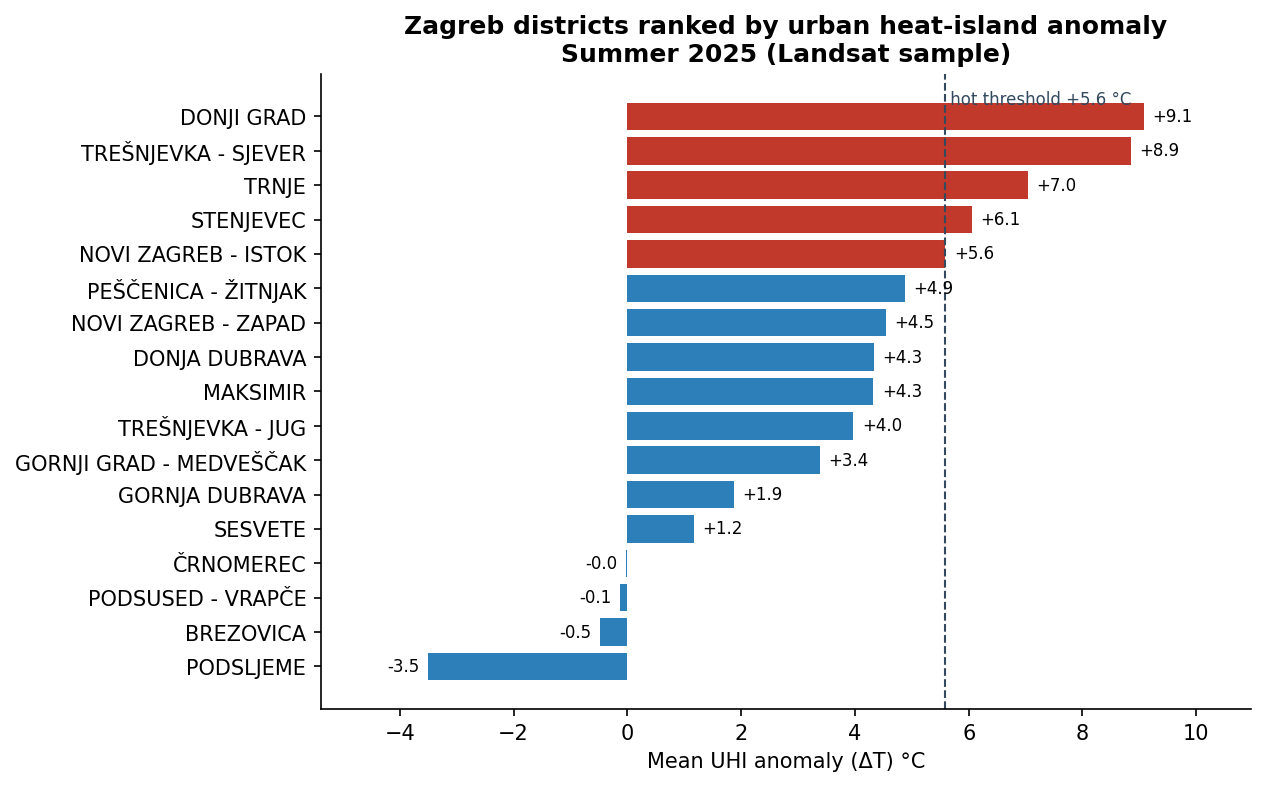
Data table for this chart
| District | 2026 ΔT (°C) | 2025 ΔT (°C) |
|---|---|---|
| Trešnjevka – sjever | +8.3 | +8.9 |
| Donji Grad | +8.1 | +9.1 |
| Novi Zagreb — Istok | +6.7 | +5.6 |
| Trnje | +6.5 | +7.0 |
| Peščenica – Žitnjak | +5.8 | +4.9 |
| Stenjevec | +5.7 | +6.1 |
| Podsljeme | −3.6 | −3.5 |
That holds for reducing temperature. A separate model (RQ-H) attributes most neighbourhoods’ heat risk mainly to demographic sensitivity rather than to the climate signal — around six in seven of those it can fit. The two are not in conflict, but they answer different questions, and the choice between people-focused and vegetation-focused spending should say which model it rests on.
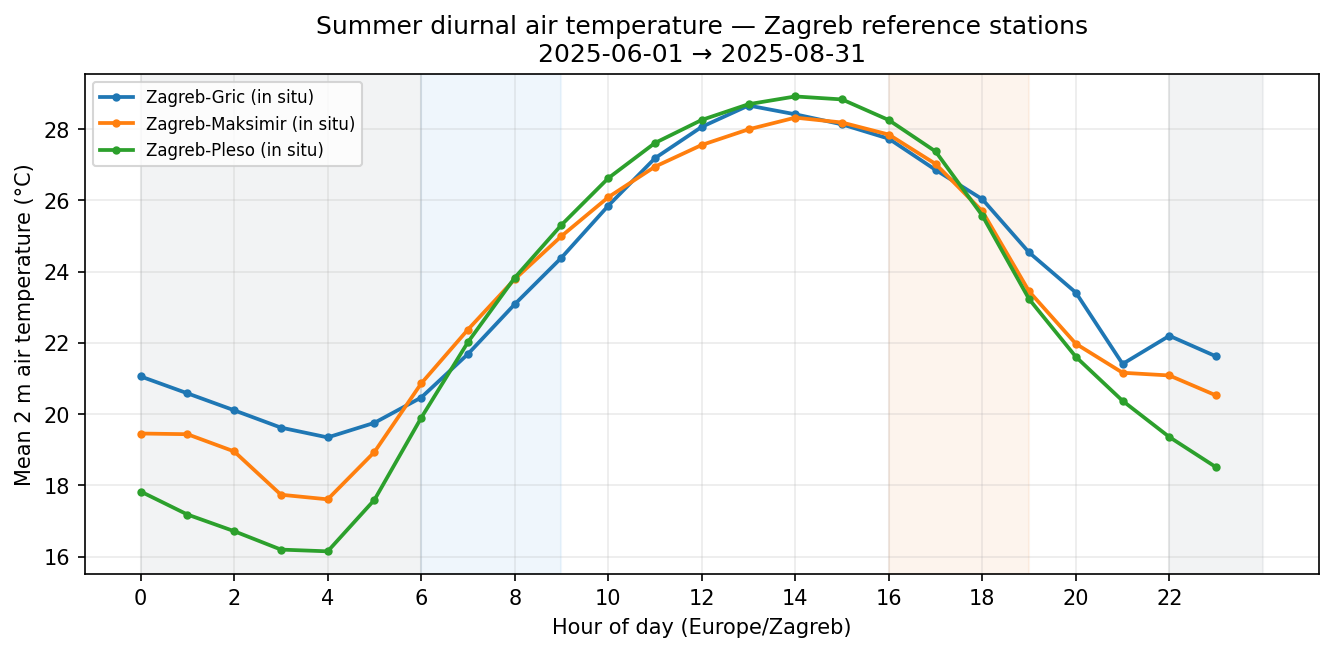
Complementary air temperature (three reference stations) shows hot afternoons often reaching the mid-30s °C, while seasonal averages sit nearer ~28 °C. Night-time land-surface snapshots show a much narrower spread (~17–21 °C) than daytime heat, with the inner city still slightly warmest.
Key numbers
Summer 2025 as published, with the summer 2026 figure beside it where the two are measured the same way. The 2025 satellite figures have been rebuilt on the same 8,000-pixel basis as 2026 so the columns are comparable — see RQ-K for why, and for the figures as they were originally published. Same marks a measure that does not vary by summer (census, or fixed geography); Not re-run marks an analysis still awaiting a 2026 pass.
| Measure | Summer 2025 | Summer 2026 |
|---|---|---|
| Mean land-surface temperature, citywide | 33.2 °C | 33.5 °C |
| Urban heat-island intensity (built-up − rural) (matched basis) | +6.4 °C | +6.2 °C |
| Hottest district, mean heat anomaly (matched basis) | +9.1 °C — Donji Grad | +8.3 °C — Trešnjevka – sjever |
| Coolest district (Podsljeme), mean heat anomaly (matched basis) | −3.5 °C | −3.6 °C |
| Dense and hot neighbourhoods | 32 of 218 | Not re-run |
| Vegetation index vs surface temperature | −0.78 | −0.79 |
| Max heat-vulnerability index (HVI) | 0.76 (Nadbiskup Antun Bauer) | Not re-run |
| Facilities inside 32 hot + dense MOs | 242 | Not re-run |
| Drinking fountains in the city dataset (all 17 districts) | 10 | Same |
| Hot + dense MOs with no drinking fountain in the dataset | 30 of 32 | Not re-run |
| City-wide heatwaves (DHMZ-style) | 3 events | 6 events |
| Thermal-priority residential parcels (2025 / 2024) | 481 / 433 | 521 parcels (2026) |
Research questions & answers
The satellite and census analysis addressed eleven practical questions about where heat concentrates, how strong it is, and who is affected. The six with distinct findings are below, on summer 2026 data; the rest are covered in air temperature, night surfaces and heatwaves. Ten further lettered analyses (A to K) extend the work into planning, lived experience, adaptive capacity, which intervention lever fits where, the city's own tree register, where every line of evidence agrees, and how the two measured summers compare.
Question 1
Where in the city is it hottest?
The hottest surfaces are in the dense inner city. Trešnjevka – sjever, Donji Grad, and Trnje average about 41, 41, and 39 °C land-surface temperature; green Podsljeme averages 29 °C — roughly a 12 °C spread across the city in one summer. Built-up areas average 39 °C; tree cover 31 °C; water 31 °C.
Question 2
How strong is the heat island?
Built-up areas are on average +6.2 °C warmer than the rural/green reference. Five districts exceed the citywide “hot” threshold (75th percentile, ΔT ≥ +5.8 °C):
- Trešnjevka – sjever — +8.3 °C
- Donji Grad — +8.1 °C
- Novi Zagreb — Istok — +6.7 °C
- Trnje — +6.5 °C
- Peščenica – Žitnjak — +5.8 °C
Podsljeme (−3.6 °C) and Brezovica (0.0 °C) sit at or below the reference. The gradient runs from the green north hillside through the overheated centre to mixed southern and eastern fringes.
Question 3
Does vegetation cool the city?
Yes, clearly. Greener pixels are reliably cooler (correlation −0.79). Podsljeme is the greenest (NDVI 0.81) and coolest district; Donji Grad the least green (NDVI 0.27). Tree cover can shift a pixel’s heat anomaly from about +6 °C in built-up areas to −2 °C under trees.
 Open full-size chart
Question 5
Who lives where it is hot?
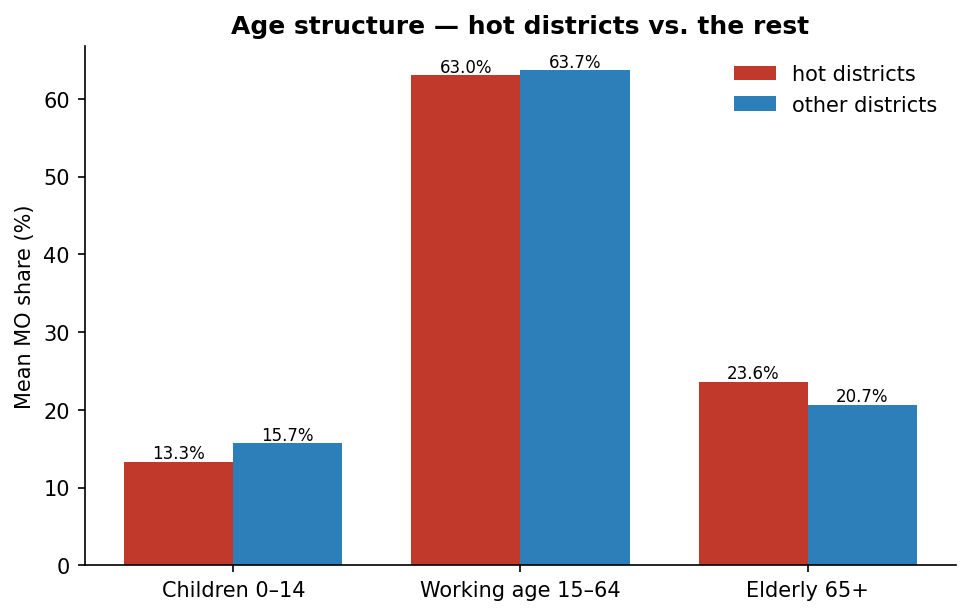
31 neighbourhoods in 2026 (32 in 2025) are in both the top quartile for population density and a top-quartile hot district. The frame shifted with the hot-district set: the four Stenjevec neighbourhoods left it, and three Peščenica – Žitnjak ones (Janko Matko, Peščenica, Volovčica) entered. The densest include Matko Laginja (~24,000 people/km²) and Nadbiskup Antun Bauer (~20,500 people/km²).
Residents aged 65+ concentrate in Donji Grad (e.g. Hrvatski narodni vladari 46%, Mimara 42%) and Trnje (Cvjetnica 38%) — also the hottest areas. Children (0–14) peak in parts of Novi Zagreb — Istok (Veliko Polje, Jakuševec), itself a hot district.
Question 7
Which residential areas should be prioritised for heat mitigation?
A screening flagged residential parcels with unusually low vegetation and high surface temperature — mostly dense inner-city housing. They align with the highest-scoring planning units and are strong candidates for trees, façade greening, and surface treatments. The screening flagged 521 parcels in 2026, up from 481 in 2025 (433 in 2024) — though their median surface temperature fell slightly, because a larger parcel set pulls in cooler ones. A top-20 shortlist is also in circulation and its relationship to the full set has never been documented, so treat the count as provisional and confirm boundaries on the map before policy use.
Question 8
Does the composite heat index match the district picture?
Mostly yes. Both the simple district ranking and a composite index identify the same hot core: Trešnjevka – sjever, Donji Grad, Trnje. The composite regression fits R² = 0.92 across 915 urban-rule polygons, with 209 significant high-high clusters. Once vegetation and green-zone share are considered, built-up area alone is not a significant driver — missing greenery and impervious surfaces matter more than density labels alone.
Air temperature, daily rhythms & elderly exposure
Question 9
People experience air temperature, not roof temperature — and when heat peaks (commute, work, night) matters for health messaging as much as where on the map.
What the weather stations show
Three reference stations (Grič city centre, Maksimir, Pleso) were analysed for June–August 2026. Seasonal averages understate discomfort: afternoon work hours average 27.5–28.1 °C, while 95th-percentile hours reach 34.7–35.4 °C. The bigger change is at night: all three stations now sit at 20.8–21.3 °C overnight, against 17.7–20.5 °C in 2025. Pleso, which used to be much the coolest after dark, no longer is — the clearest station-level sign of the nocturnal warming behind 2026's heatwaves.
| Station | Daytime mean | Hot-day tail (95th %) | Night mean | Night mean, 2025 |
|---|---|---|---|---|
| Grič (centre) | 27.5 °C | 34.7 °C | 20.8 °C | 20.5 °C |
| Maksimir | 27.7 °C | 34.9 °C | 21.0 °C | 19.4 °C |
| Pleso (open) | 28.1 °C | 35.4 °C | 21.3 °C | 17.7 °C |
Modelled air at neighbourhood scale
A European reanalysis product, bias-corrected against the three stations (a +0.53 °C correction for 2026), puts estimated neighbourhood air at 25.8–28.9 °C citywide (σ ≈ 0.50 °C) — about a 3 °C spread, so the grid is still too coarse for block-level differences. Use stations for absolute air and timing; use the map layer for relative ranking combined with census.
Land surface vs air
Where both are available, land surface is on average 7.3 °C hotter than air at neighbourhood centroids in 2026 (range +1.4 to +13.9 °C), down from 7.7 °C in 2025 — the gap narrowed because air warmed while the surface stayed close to flat. Health and comfort narratives need both: satellites show surface hotspots; thermometers show breathed air.
Elderly heat exposure on the map
The map layer Elderly heat exposure score combines share of residents aged 65+ with ranked modelled daytime air. Because neighbourhood air is nearly uniform spatially, the pattern is driven mainly by who lives where, with a modest boost where air sits in the upper tail.
Highest-scoring neighbourhoods:
| Neighbourhood | District | Share aged 65+ | Est. air (°C) |
|---|---|---|---|
| Hrvatski narodni vladari | Donji Grad | 46% | 27.5 |
| Mimara | Donji Grad | 42% | 27.5 |
| Cvjetnica | Trnje | 38% | 27.5 |
| August Cesarec | Gornji Grad — Medveščak | 36% | 27.4 |
| Sloboština | Novi Zagreb — Istok | 32% | 27.5 |

Night-time land-surface temperature
Question 10
This addresses night-time heat retention at the ground and roof surface — relevant for sleep comfort — not the same as night air temperature (see Question 9).
Coverage improved markedly in 2026: nine night passes were found and six were usable for the composite, against three and two in 2025. Night surface temperatures remain far more uniform across the city (~18–23 °C at neighbourhood scale) than daytime Landsat heat (~34 °C city mean), and the whole distribution shifted up: the neighbourhood median rose from 19.3 °C to 20.6 °C, with the coolest neighbourhood now warmer (17.9 °C) than 2025's coolest (13.8 °C). With six scenes this is firmer than 2025's two-pass snapshot, but still not a full night climatology.
| Metric | Daytime (Landsat summer) | Night (ECOSTRESS) |
|---|---|---|
| Citywide mean / typical | ~34 °C LST | ~21 °C LST |
| Approx. district spread | ~12 °C (29 – 41 °C) | ~4 °C (fringe – inner core) |
| Scenes used | Multi-date summer composite | 6 of 9 clear night swaths |
Warmest districts: Donji Grad (22.7 °C) and Trnje (22.5 °C). Coolest fringe: Brezovica (18.6 °C) and Podsljeme (19.3 °C). The inner-city ordering is unchanged from 2025 — what changed is the level, with every district about 2 °C warmer at night.
Station night air runs Grič 20.8 °C, Maksimir 21.0 °C, Pleso 21.3 °C — similar order of magnitude to night surface medians, but the two should not be read as the same number for a given neighbourhood.
Pair night LST with the Elderly × warm night LST layer on the dashboard. Because night surface spread is small, high elderly-share areas in Donji Grad and Trnje still dominate the score — similar to the daytime exposure layer.
Heatwave detection & spatial disparity
Question 11
A heatwave here follows the DHMZ definition: three or more consecutive days with Tmax ≥ 30 °C and Tmin ≥ 20 °C — a tropical night — at the same location. Detection runs independently at each of the 218 neighbourhood centroids, on station-calibrated ERA5-Land.
| Measure | Summer 2025 | Summer 2026 |
|---|---|---|
| City-wide heatwave events | 3 | 6 |
| Heatwave days per neighbourhood, median | 15 | 32 |
| Heatwave days, range across neighbourhoods | 0–23 | 7–38 |
| Neighbourhoods with no heatwave at all | 5 | 0 |
| Tropical nights per neighbourhood, mean | 29.0 | 43.9 |
The spatial disparity persists in both years. Eastern lowland neighbourhoods carry the most heatwave days; elevated Medvednica neighbourhoods in Podsljeme carry the fewest — the five with none in 2025 were all there. The strongest predictor of heatwave days is the summer mean night-time minimum temperature (r = 0.91), far stronger than daytime land-surface temperature (r = 0.36): a neighbourhood that cools below 20 °C at night cannot meet the tropical-night criterion however hot its roofs get by day.
Heat × population, markets & cycling
Hot districts (recap)
A district counts as “hot” if its mean heat anomaly is at or above the 75th percentile of all 17 districts. For 2026 that threshold is +5.8 °C and the five are Trešnjevka – sjever, Donji Grad, Novi Zagreb — Istok, Trnje and Peščenica – Žitnjak. In 2025 the threshold was +5.6 °C and Stenjevec held the fifth place now taken by Peščenica – Žitnjak.
Population × heat
| Dimension | Top neighbourhoods (citywide) | In hot districts |
|---|---|---|
| Elderly (65+) | Hrvatski narodni vladari · Mimara · Cvjetnica · Gupčeva zvijezda · August Cesarec | 3 of 5 |
| Children (0–14) | Veliko Polje · Budenec · Odra · Jakuševec · Novi Jelkovec | 2 of 5 |
| Population density | Matko Laginja · Nadbiskup Antun Bauer · Novi Jelkovec · Gajnice · Špansko — Sjever | 3 of 5 |
Headline: Vulnerable populations and the urban heat island partly coincide. Three of the five oldest neighbourhoods and three of the five densest sit in hot districts — a real overlap, but not a complete one. Citywide only 22.7% of residents aged 65+ live inside the 32 hot-and-dense neighbourhoods, so heat exposure and elderly concentration are two overlapping maps, not one.
Outdoor markets in hot areas
8 of 31 city outdoor markets sit in hot districts, including all three Donji Grad markets: Kvaternikov trg, Branimirova, Zagreb UPRAVA; plus Trešnjevka, Trnje, Savica, Špansko, and Utrina. These are places where people — often elderly — are outdoors in the hottest hours. Shading, drinking water, and cooler surfaces at these markets would have visible public-health benefit.

Cycling infrastructure in hot areas
The city reports 274 km of cycling-related network when shared paths and road markings are included; about 61 km is strictly dedicated bike path or lane. In hot districts:
- Trešnjevka – sjever (the hottest district in 2026) has no strictly dedicated cycling infrastructure — only shared paths.
- Donji Grad has only ~1.7 km dedicated of ~20 km total — narrow historic streets limit options.
- The longest dedicated networks are in cooler or mid-heat districts (e.g. Novi Zagreb – zapad, Trešnjevka – jug).
In hot areas, feasible improvements are often shade and microclimate along existing shared paths rather than new segregated lanes.

Priority neighbourhoods & interventions
Ten neighbourhoods score on multiple dimensions at once: hot district, high density, and above-average elderly share. They are a defensible starting point for targeted heat action — with three caveats worth stating up front.
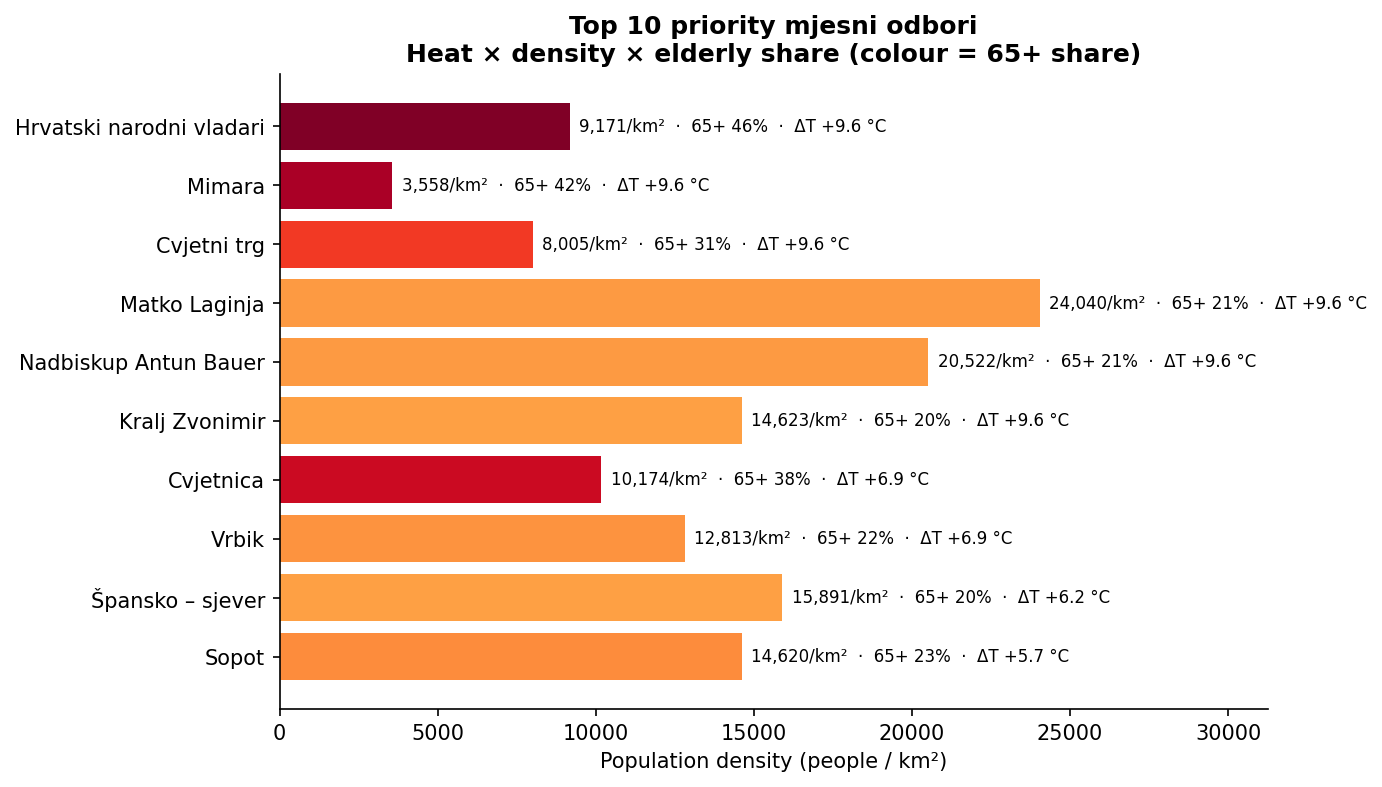
| # | Neighbourhood | District | Density | 65+ | Heat ΔT | Intervention ideas |
|---|---|---|---|---|---|---|
| 1 | Hrvatski narodni vladari | Donji Grad | 9,171/km² | 46% | +8.1 °C | Courtyard trees; cool roofs; shaded seating and drinking water near care routes. |
| 2 | Mimara | Donji Grad | 3,558/km² | 42% | +8.1 °C | Façade greening; trees along Roosevelt and Mihanovićeva; museum forecourt greening. |
| 3 | Cvjetni trg | Donji Grad | 8,005/km² | 31% | +8.1 °C | Light-coloured paving in pedestrian zones; temporary shade on Bogovićeva. |
| 4 | Matko Laginja | Donji Grad | 24,040/km² | avg. | +8.1 °C | Highest priority for inner-block greening and permeable courtyard surfaces. |
| 5 | Nadbiskup Antun Bauer | Donji Grad | 20,522/km² | avg. | +8.1 °C | Link interior courtyards into a cooling network. |
| 6 | Kralj Zvonimir | Donji Grad | 14,623/km² | avg. | +8.1 °C | Trees on Kneza Branimira; shade upgrade at Tržnica Branimirova. |
| 7 | Cvjetnica | Trnje | 10,174/km² | 38% | +6.5 °C | Shaded seating near healthcare; trees along Vukovarska; cool-pavement pilot streets. |
| 8 | Vrbik | Trnje | 12,813/km² | avg. | +6.5 °C | Canopy along Vukovarska/Savska; micro-parks from oversized parking; Sava embankment cool corridor. |
| 9 | Špansko — Sjever | Stenjevec | 15,891/km² | avg. | +5.7 °C | Green roofs on flat blocks; inter-block planting; shade at Tržnica Špansko. |
| 10 | Sopot | Novi Zagreb — Istok | 14,620/km² | avg. | +6.7 °C | Connect inter-block greenery; water feature or spray park; link with estate retrofits. |
Intervention types (by impact)
- Street and courtyard tree planting — often the most cost-effective; mature trees can lower local heat anomaly by 2–5 °C.
- Cool roofs and façades — especially on large post-war estates.
- Shade at outdoor markets — eight named hot-district markets.
- Drinking-water points along bike corridors and at markets.
- Light, permeable surfaces in dense pedestrian zones.
- Green façades and pocket parks where street trees are not possible.
Where every line of evidence agrees
Everything above is organised around one measurement: daytime land-surface temperature. There are now six independent axes — daytime heat, heatwave days, resident-reported burden, street shade, socioeconomic standing and cooling capacity — built from different data by different methods. Counting how many place a district in the worst tier changes the picture.
| Axes flagged (2026) | District | Daytime ΔT | What flags it |
|---|---|---|---|
| 4 | Trešnjevka – sjever | +8.3 °C | daytime heat · heatwave days · lived burden · no street shade |
| 4 | Peščenica – Žitnjak | +5.8 °C | daytime heat · lived burden · low income · low AC |
| 4 | Donja Dubrava | +4.2 °C | lived burden · no street shade · low income · low AC |
| 4 | Sesvete | 0.0 °C | no street shade · low income · low AC · 2 critical hotspots |
| 3 | Novi Zagreb – zapad | +5.2 °C | heatwave days · lived burden · no street shade |
| 3 | Gornja Dubrava | +1.4 °C | lived burden · low income · low AC |
| 2 | Donji Grad | +8.1 °C | daytime heat · 5 critical hotspots |
| 2 | Novi Zagreb – istok | +6.7 °C | daytime heat · heatwave days |
| 2 | Trnje | +6.5 °C | daytime heat · 3 critical hotspots |
| 1 | Stenjevec | +5.7 °C | 5 critical hotspots |
| 0 | Maksimir · Gornji Grad – Medveščak · Podsljeme | — | no district-scale flag |
2026 lines up better than 2025 did. Trešnjevka – sjever is now both the hottest district and the most broadly flagged, which it was not last summer, and Peščenica – Žitnjak picked up the daytime-heat flag as it entered the hot five. But two of the four most-flagged districts — Donja Dubrava (+4.2 °C) and Sesvete (0.0 °C) — still sit outside the daytime ranking entirely. The mechanism is specific: the eastern lowlands release heat slowly at night (tropical nights), have the weakest cooling capacity and lowest incomes (RQ-G), and their residents report among the highest lived burden (RQ-F) — while their daytime surface temperatures stay unremarkable because the built fabric is less dense.
That still gives two priority cases rather than one ranking. Intensity in the inner ring: Donji Grad, Trnje, Trešnjevka – sjever and Stenjevec hold the extreme anomalies and 13 of the 21 critical hotspots between them. Breadth in the eastern lowlands, driven by night-time heat retention and adaptive capacity rather than daytime surface heat.
What residents report
Everything above is measured from satellites and the census. In 2026 the city’s heat survey added the first lived-experience layer at scale: 7,329 residents across all 17 districts (up from 7,289 at the previous export and 5,902 before that), rating heat burden across 14 areas of daily life, 18 coping behaviours and 28 proposed interventions.
67% find heat hard or very hard 75% avoid the outdoors at peak heat 91% want the City to act r = 0.61 burden vs. satellite heat
Heat takes away the outdoors, not the indoors
The hardest-rated part of daily life is outdoor leisure elsewhere in the city (3.35 of 4), followed by sport and recreation (3.33) and leisure in the neighbourhood (3.29). Being at home rates 2.54–2.68 and being at work only 2.32. The eight hardest-rated domains all involve being outside and moving around — including 3.21 for escorting someone you care for.
The self-reported ranking does not match the satellite ranking
Across the 16 districts with a reliable sample, self-reported burden tracks measured heat reasonably well overall (r = 0.61). District for district, it does not:
| District | Heat rank (satellite) | Burden rank (residents) | Street shade (1–5) |
|---|---|---|---|
| Trešnjevka – sjever | 1 of 17 | 3 of 16 | 2.41 — near-worst in city |
| Donji Grad | 2 of 17 | 14 of 16 | 3.00 |
| Trnje | 4 of 17 | 5 of 16 | 3.21 |
| Stenjevec | 6 of 17 | 13 of 16 | 3.07 |
| Novi Zagreb – istok | 3 of 17 | 8 of 16 | 3.57 — best in city |
| Donja Dubrava | 8 of 17 | 1 of 16 | 2.37 — worst in city |
| Peščenica – Žitnjak | 5 of 17 | 2 of 16 | 2.89 |
Trešnjevka – sjever appears near the top of both. But the sharpest divergence is now Donja Dubrava: 8th of 17 on physical heat, yet 1st of 16 on lived burden and the worst-shaded district in the city. Peščenica – Žitnjak and Gornja Dubrava show the same pattern — high lived burden, mid-table-to-cool physical ranking — and they are among the eastern districts that carry the most heatwave days.
Capacity falls with age; reported burden does not
Every measure of how well someone can cope worsens steadily with age. The burden index does not — it peaks in the 25–34 band and is lowest among the over-65s:
| Age band | n | Copes poorly | Working AC | Chronic illness | Vulnerability | Reported burden |
|---|---|---|---|---|---|---|
| 15–24 | 273 | 49% | 85% | 8% | 0.15 | 2.96 |
| 25–34 | 1,367 | 66% | 86% | 15% | 0.18 | 3.03 |
| 35–49 | 3,087 | 66% | 87% | 20% | 0.21 | 2.98 |
| 50–64 | 2,077 | 70% | 85% | 32% | 0.24 | 2.95 |
| 65+ | 509 | 71% | 75% | 50% | 0.42 | 2.86 |
Near-unanimous on trees, split on parking
All five of the most-supported measures are tree measures — tree-lined paths 4.83 of 5, greening squares and roundabouts 4.82, greening school yards 4.81. Both least-supported measures take away parking: converting parking to trees scores 3.78 and temporary parking greening 3.49, the single most-opposed of the 28. The split is not green versus grey — it is green that costs a parking space versus green that does not.
Who can actually cope?
Exposure is not the same as risk. Donji Grad is the second-hottest district in Zagreb and the second most affluent — high education, the city’s highest wage estimate, above-average air conditioning. So is it really the top priority? The socioeconomic and survey data now let us test that directly, and the answer is more useful than a simple yes or no.
In Zagreb, richer districts run hotter
Composite socioeconomic index against district heat anomaly gives a positive correlation (r ≈ +0.40, n = 17). Gornji Grad – Medveščak and Donji Grad rank first and second on affluence, and both sit in the top four for heat. The poorest districts — Sesvete, Gornja Dubrava, Brezovica — sit at the cool end (0.0 °C, +1.4 °C, 0.0 °C), because they are lower-density peripheral fabric. The same variable drives both: dense, historic, low-vegetation urban form.
District averages hide the households that matter
This is where the “Donji Grad is affluent, so it copes” reading breaks down. District affluence does not mean household affluence:
| Group (survey) | n | Working AC | Vulnerability (0–1) | Income hardship |
|---|---|---|---|---|
| All respondents | 7,329 | 85.5% | 0.22 | 38.0% |
| Donji Grad, all | 539 | 83.0% | 0.25 | 37.6% |
| Donji Grad, aged 65+ | 82 | 70.4% | 0.46 | 47.5% |
| Citywide, 65+ and income hardship | 237 | 66.5% | 0.54 | 100% |
Donji Grad ranks second of seventeen on affluence. At district level its own cost-difficulty rate (37.6%) now tracks the citywide mean (38.0%) closely — at the previous, smaller export it ran slightly above it. The subgroup that matters is still there: residents aged 65+ report 47.5% hardship, ten points above the district's own average, and the lowest air-conditioning ownership and highest vulnerability of any Donji Grad subgroup. The elderly share in some of its neighbourhoods reaches 46%.
Three hot districts, three different problems
| Place | What the data says | What that implies |
|---|---|---|
| Donji Grad | Second-hottest district (+8.1 °C); highest elderly concentration (up to 46% per neighbourhood); affluent on average, but its residents aged 65+ report 47.5% hardship and only 70.4% AC; third-worst tree visibility (2.42) | High exposure with unevenly distributed capacity. The gap is public-realm shade and support for the people who cannot retreat indoors — not district-wide subsidy |
| Trešnjevka – sjever | Hottest district in 2026 (+8.3 °C); near-worst street shade (2.41 vs. 2.99 mean, now second only to Donja Dubrava); near-worst tree visibility (2.36); 3rd-highest self-reported burden; 0 km of strictly dedicated cycling infrastructure | The clearest physical-intervention case in Zagreb: exposure, missing canopy and lived complaint all point the same way. This is why it is the shading-pilot site |
| Peščenica – Žitnjak and Donja Dubrava |
Peščenica – Žitnjak is now in the hot five (+5.8 °C); Donja Dubrava sits just below (+4.2 °C) — both with below-average AC (58.7%, 56.2%); ranked 13th and 17th of 17 on the socioeconomic index; highest unemployment in the city; now 2nd and 1st for self-reported burden of all 16 reliable-sample districts, and among the worst for heatwave days | The only places where exposure, poverty and missing cooling capacity converge. Here the gap includes cooling capacity itself, not just shade |
Citywide, air-conditioning prevalence rises with heat exposure (r ≈ 0.70) — the hot core also has newer housing stock. Peščenica – Žitnjak and Donja Dubrava are the two districts that break that pattern in the direction that matters.
Health baseline — and what we still cannot show
Zagreb’s public-health yearbook for 2024 gives a solid mortality and emergency-care baseline. It does not, and cannot, demonstrate a heat–health link in this city. Both halves of that matter.
What the baseline shows
| Measure | Value (2024–2025) |
|---|---|
| Population, City of Zagreb (2024) | 774,225 — up from 767,131 at the 2021 census |
| Residents aged 65+ (2024) | 160,725 (21%) — 158,773 at the 2021 census used elsewhere on this page |
| Deaths, City of Zagreb | 8,635 (1,115.3 per 100,000) |
| Leading cause of death | Circulatory disease — 38.4% of all deaths |
| Circulatory + respiratory + endocrine combined | 50.3% of all deaths — the heat-sensitive categories |
| Emergency interventions for residents aged 65+ | 72% of 183,070 — while 65+ are 21% of the population |
| Residents registered with a disability | 118,082 (15.3%); 33.2% of all residents aged 65+ |
| Emergency-team-to-population ratio | Worst of Croatia’s 21 counties — 10,228 people per team vs. a 5,260 national average |
Half of all deaths in Zagreb fall in exactly the cause categories the heat-health literature identifies as driving warm-season excess mortality, and older residents consume emergency care at more than three times their population share. That is a real vulnerability baseline for an ageing, overheating inner city.
What we cannot show, and why
Closing this gap needs an anonymised, aggregated series for 2015–2024, by epidemiological week and city district, covering all-cause, cardiovascular and respiratory mortality, emergency interventions and hospital admissions. Weekly resolution preserves the 3–5 day signal while staying aggregated enough for privacy. Until that exists, treat every heat–health statement about Zagreb as inference from the literature, not local measurement.
What this means for the team
- Prioritise neighbourhoods, not only districts. The dense-and-hot areas — 31 in 2026, 32 in 2025, with 12 in Donji Grad — are the actionable units.
- Tie heat to people. Elderly concentration in Donji Grad and Trnje is the most policy-relevant pattern.
- Use markets and bike corridors as concrete project lists. Shade, water, and trees at named places.
- Invest in vegetation. Cooling Zagreb means adding green, not only limiting building.
- Combine surface heat, air timing, and population. The map shows where; station profiles show when; census shows who.
- Target nighttime heat retention. Heatwave exposure is driven by tropical nights (Tmin ≥20 °C), not daytime peaks. Permeable surfaces, tree canopy, and green roofs in eastern lowland MOs would cut heatwave days disproportionately.
- Target households, not postcodes. Adaptive capacity splits by household: Donji Grad's residents aged 65+ report 47.5% cost difficulty, ten points above the district's own average, despite the district ranking second on affluence, and citywide, residents aged 65+ with income hardship have the lowest air conditioning (66.5%) and highest vulnerability (0.54) of any group. Do not read district affluence as protection — and do not retarget on income either, since richer districts here run hotter (why).
- Prioritise shade in public space. Residents rate outdoor leisure, sport and errands as the hardest parts of a hot day (3.25–3.35 of 4) and being at home or at work as the easiest (2.32–2.68). Street shade is also the survey measure that separates districts most sharply — and Donja Dubrava is worst in the city, with Trešnjevka – sjever a close second-worst.
- Expect friction on parking, not on trees. Tree measures score up to 4.83 of 5; both parking-conversion measures are the most opposed of 28 (3.49 and 3.78). Budget engagement effort for that specific trade-off.
- Match the lever to the neighbourhood. RQ-H separates 21 critical hotspots and 34 demographic-sensitive neighbourhoods from 29 climate hotspots. The first two call for shade, water, refuges and outreach timed to the local age structure; the third calls for canopy and surface work. Twenty neighbourhoods are surface-hot but air-decoupled, where cool roofs and lighter pavement should outperform general ambient cooling.
- Split the priority list in two. Six independent axes flag the eastern lowlands (Donja Dubrava and Sesvete on five each, Peščenica – Žitnjak on four) more often than the hot inner ring, while the inner ring holds the extreme anomalies and 13 of the 21 critical hotspots. Report both cases and say which one an intervention serves (why).
- Do not read the tree register as canopy. Cadastred tree density rises with heat (r = +0.70), because it maps municipal street trees, not canopy — Podsljeme, the coolest and greenest district, has 577 of them. Only 15.6% of the 162,676 trees are 16 m or taller and 35% are under 5 m, so "we planted N trees" is a statement about shade a decade from now (RQ-I).
- Request weekly health data. The heat–mortality link cannot be tested with monthly figures. Ask NZJZ “Dr. Andrija Štampar”, the City or HZJZ for 2015–2024 mortality, emergency interventions and admissions by epidemiological week and district (why this is the blocker).
Future research directions
- More night-time satellite coverage for a stable summer night picture.
- Multi-year trend (2015–2025) — implemented: see RQ-E and NDVI trend.
- Heatwave spatial analysis — implemented for both summers: DHMZ-style detection per MO; 3 city-wide events in 2025 rising to 6 in 2026 (see heatwaves).
- TALEA-inspired raster layers — implemented: four layers on the dashboard, documented in Data and Methods.
- Heat combined with air quality at monitoring stations.
- Resident-reported heat burden at scale — implemented: see RQ-F and what residents report.
- Socioeconomic status and adaptive capacity against exposure — implemented: see RQ-G and ability to cope.
- Weekly, district-level mortality and emergency-care data to test the heat–health link — outstanding, and the single biggest evidence gap: see health baseline.
- Neighbourhood-level (not district-level) health, income and air-conditioning data, so capacity can be joined to the 218-neighbourhood heat layers rather than compared across 17 districts.
- A further survey wave with quotas for residents aged 65+ — the sample has grown three times since the first snapshot (4,510 → 5,902 → 7,289 → 7,329) but still without age quotas, so 65+ respondents remain under-represented (6.9% of the sample against 21% of the population).
- Schools, kindergartens, and care homes overlaid on hot neighbourhoods — implemented: see RQ-B.
- Tree-cover gap analysis per hot neighbourhood — implemented: see RQ-C and district greenery.
- Walking access to parks and cool public buildings — implemented: see RQ-D.
- A single heat-vulnerability index per neighbourhood — implemented: see RQ-A.
Problem frames workshop board
Twelve ways to frame the urban heat problem — each with a headline number from the analysis. Click cards to shortlist frames for team workshops.
By location
By population
By activity / outdoor exposure
By systems / adaptive capacity
By cause / lever
By time
By priority tool
12 frames across 7 lenses. Every headline number was verified against the analysis tables. Green badge = directly reproduced from data; amber = true but with a stated caveat. Two angles are intentionally absent — where interventions currently exist, and heat × air-quality — because that data has not been computed.
Research questions A–K (planning analysis)
Composite heat-vulnerability index, sensitive facilities, tree-cover deficit, cool-refuge access and multi-year UHI trends for the 32 hot-and-dense neighbourhoods (A–E, May 2026 analysis run), extended with resident-reported heat burden (F) and adaptive capacity against exposure (G), per-neighbourhood driver attribution (H), the tree cadastre (I) and a cross-axis convergence check (J), and the summer 2025 vs 2026 comparison (K), added September 2026.
RQ-A — Composite Heat-Vulnerability Index
Weighted HVI across all 218 mjesni odbori: UHI, elderly share, density, NDVI gap, and heatwave days.
Map layer: Heat vulnerability index (HVI) under Findings.
Summer 2025 index. The HVI has not been recomputed for 2026 — two of its five inputs are unavailable for that summer — so the scores and the district anomalies quoted here are the 2025 values. The hot-and-dense screening it feeds has been redone for 2026; see RQ-K.
Method
Composite HVI weights:
- UHI anomaly — 30%
- Elderly share — 25%
- Population density — 20%
- NDVI gap — 15%
- Heatwave days — 10%
Headline numbers
- Max HVI: 0.762 — Nadbiskup Antun Bauer (Donji Grad)
- Citywide mean HVI: 0.417 across 218 MOs
- 32 high-priority hot + dense neighbourhoods
- 12 of those top-priority MOs are in Donji Grad
Top neighbourhoods (illustrative)
- Nadbiskup Antun Bauer — HVI 0.76, ΔT +9.1 °C, elderly 29%, density ~20.5k/km²
- Pavao Šubić — HVI 0.75
- Travno (Novi Zagreb — Istok) — HVI 0.74
- Hrvatski narodni vladari — HVI 0.74, elderly 46%
- Matko Laginja — HVI 0.73, density ~24k/km²
Note
MOs without direct Landsat NDVI sampling use an NDVI gap estimated from UHI anomaly (regression ΔT ≈ 14.7 − 18.7×NDVI, R²=0.77). Ranking is robust; absolute gap values are refined in RQ-C.
Loading…
RQ-B — Sensitive Facilities in Hot Neighbourhoods
Schools, kindergartens, healthcare, sport sites and fountains inside the 32 hot + dense mjesni odbori.
Map layer: Sensitive facilities under Vulnerability (points in hot / high-HVI MOs highlighted).
Counts are against the summer 2025 hot-and-dense frame of 32 neighbourhoods. That frame is 31 in 2026 — four Stenjevec neighbourhoods left, three in Peščenica – Žitnjak entered — so these facility totals have not been recounted for the newer set.
Method
Facilities from City of Zagreb GeoHub / ArcGIS (pharmacies, kindergartens, elementary and high schools, sport facilities, drinking fountains) assigned to nearest mjesni odbor (≤4 km).
Headline numbers
- 242 facilities inside the 32 hot + dense MOs
- 62 health / pharmacy
- 71 kindergartens
- 32 elementary schools
- 29 high schools
- 29 of 96 high schools citywide (30.2%) — the most over-exposed facility type, against 21.3% of kindergartens and 18.1% of elementary schools
- 30 / 32 of those MOs have no drinking fountain — but see the caveat below
The fountain figure needs context
The city dataset contains only 10 drinking fountains across all 17 districts, two of them inside the 32 hot MOs. “30 of 32 have zero” is therefore as much a statement about dataset coverage as about a deficit targeted on hot neighbourhoods — Zagreb has more public water points on the ground than this source records. The defensible version of the finding pairs it with need: 20 of the 32 hot-and-dense MOs have no water point within a 10-minute walk and an above-average elderly share, which is a concrete siting shortlist rather than a coverage artefact.
Why it matters
Heat risk is not only rooftop temperature — it is also where children, patients, and outdoor users concentrate on hot days. Use the dashboard to overlay facilities on HVI or summer LST.
Loading…
RQ-C — Tree-Cover Deficit and Cooling Potential
NDVI gap against a realistic greening target, and the modelled cooling if that gap were closed.
Map layer: Tree cover deficit under Greenery (all 218 neighbourhoods).
Method
Compare current NDVI to a realistic greening target — Stenjevec-style district NDVI of 0.422 — and convert the gap into modelled cooling using the study’s regression, ΔT = 14.7 − 18.73 × NDVI (R² = 0.77).
The dashboard layer now covers all 218 mjesni odbori. The original research table still emphasises the most heat-exposed neighbourhoods; the map no longer hides the rest of the city.
What the map shows
- Realistic NDVI gap, expressed as a percentage (
max(0, 0.422 − district_mean_NDVI) × 100) - Zero means the district is already at or above the target (not “no heat”)
- Modelled cooling if the gap closed: ≈ 18.73 × NDVI gap (°C)
Headline numbers (citywide layer)
- 218 neighbourhoods mapped across 17 districts
- Largest gaps sit in the least green districts (notably Donji Grad and Trešnjevka – sjever on the latest summer sample)
- Greener outer districts sit at 0% deficit on this target
Two limits on how far this can be read
NDVI is measured per district here, not per neighbourhood. Every neighbourhood in Donji Grad shares one NDVI value; within a district the map does not separate local greenness. Ranking districts is reliable; ranking neighbourhoods inside a district is not a vegetation ranking.
The hectares-of-canopy figures from the first public draft were withdrawn (dimensional error). The layer now reports neighbourhood area and a simple gap × area order-of-magnitude field — not a validated planting target. A properly calibrated NDVI-to-canopy conversion remains outstanding.
Planning takeaway
Use the layer to see which districts sit below the greening target, then pair with heat, elderly share, and fountain/refuge access when shortlisting sites. Dense historic-core neighbourhoods have far less room for new canopy than large outer MOs even where the modelled °C gain looks similar.
Loading…
RQ-D — Cool Refuge Accessibility
Walk time from high-HVI neighbourhood centroids to the nearest cool refuge (park, shade, indoor cool space).
Map layer: Cool refuge access under Greenery.
Walk times cover the summer 2025 hot-and-dense frame of 32 neighbourhoods; that frame is 31 in 2026. The access figures themselves do not vary by summer.
Method
For priority high-HVI neighbourhoods, measure network / crow-fly access to cool refuges and green areas. Points on the map are MO centroids coloured by minutes to the nearest refuge.
How to read categories
- ≤5 min — good access
- 5–10 min — moderate gap
- >10 min — priority for new cool spaces or shaded routes
This one does not change by summer
Walk times are computed from fixed neighbourhood centroids to fixed amenity locations, so RQ-D carries no temperature input and is identical for 2025 and 2026. It does not need a per-year re-run; only a change to the park, refuge or fountain datasets would move it.
Planning takeaway
Even well-greened cities fail residents if cool spaces are not walkable during heatwaves. Pair this layer with sensitive facilities (RQ-B) to see where schools and clinics lack nearby refuge.
Loading…
RQ-E — Multi-Year UHI Trend 2015–2025
Sentinel-2 NDVI greening slopes by district, plus multi-year LST context for Donji Grad and comparison districts.
Map layer: NDVI greening trend under Greenery.
Method
Summer (Jun–Aug) mean LST (Landsat) and NDVI (Sentinel-2 from 2017 onward). District slopes show where canopy is improving or declining over time.
What the map shows
District polygons coloured by ndvi_slope (NDVI change per year). Positive slopes = greening; negative = browning / densification pressure.
Planning takeaway
Use together with tree-cover deficit (RQ-C): a district can still be hot today while slowly greening — or already cool but losing canopy. Investment tables for 2017–2025 greenery spend sit in the analysis outputs for follow-up reporting.
Loading…
RQ-F — Lived Heat Burden (Citizen Survey)
What 7,329 residents report about coping with heat, and where their experience diverges from the satellite maps.
Map layer: Citizen survey heat burden under Vulnerability & census.
Method
City-run heat survey, hand-cleaned export of October 2026: 7,329 respondents across all 17 districts (smallest sample Brezovica, n=34; largest Trešnjevka – jug, n=751). The previously published figures were on the 7,289-response export; the 40 added responses move no headline by more than 0.2 points. 110 questions cleaned and scored into a heat-burden index across 14 life domains, 18 coping behaviours, 8 climate attitudes and 28 proposed interventions. Aggregated to district and mjesni odbor level. 184 neighbourhoods have at least 5 respondents (cells below that are suppressed for privacy), with a median of 32 and 99 clearing 30 — so read the neighbourhood-level layer as indicative and the district figures as the reliable cut.
All district rankings and correlations below exclude Brezovica (n=34) — the next-smallest district sample is 143, and a 34-response district acts as a leverage point on a 16-point correlation.
Headline numbers
- 67% find hot weather “hard” or “very hard” to cope with
- 75% avoid going outdoors at peak heat “often” or “always”
- 91% agree the City should act on climate adaptation
- 85% report a working air-conditioning unit
- 38% report difficulty covering monthly household costs
Heat costs people the outdoors, not the indoors
The hardest-rated life domain citywide is outdoor leisure away from home (3.35/4), then sport and recreation (3.33) and leisure in the neighbourhood (3.29). Being at home rates 2.54–2.68 and being at work only 2.32. Residents report losing going out, not staying in — which points at street shade, shaded routes, and public space rather than building retrofit alone.
Where the survey agrees with the satellites
| Check | Result |
|---|---|
| Self-reported burden ↔ physical UHI anomaly | r = 0.61 |
| Survey vulnerability score ↔ census socioeconomic index | r = −0.41 |
| Self-reported AC ownership ↔ census-modelled AC prevalence | r = 0.54 |
Moderate-to-strong across the board: the survey is measuring something real, and physical exposure is a reasonable first-pass proxy for lived burden — but not a substitute for it.
The burden ranking is flatter than it looks
Across the 16 reliable-sample districts the burden index spans only 2.77 to 3.07 (mean 2.96). Fifteen of the 16 sit between 2.93 and 3.07. Donja Dubrava now tops the list at 3.07 — 0.005 ahead of Peščenica – Žitnjak and 0.011 ahead of Trešnjevka – sjever (which topped the ranking at wave 1) — 0.10 above the city mean. Do not treat that ordering as a priority list.
The survey question with real discriminating power is street shade, which spans 2.37 to 3.57 (mean 2.99) — four times the spread of the burden index:
| District | Street shade | Tree visibility |
|---|---|---|
| Donja Dubrava | 2.37 (worst) | 2.20 (worst) |
| Trešnjevka – sjever | 2.41 | 2.36 |
| Sesvete | 2.71 | 2.83 |
| Donji Grad | 3.00 | 2.42 |
| City mean | 2.99 | 2.90 |
| Novi Zagreb – istok | 3.57 (best) | 3.25 |
Policy support is lopsided
Tree measures are close to unanimous — tree-lined paths 4.83/5, greening squares and roundabouts 4.82, preserving existing trees 4.82, greening school yards and planting/maintaining trees both 4.81. Anything that removes parking is far more contested: temporary parking greening is the single most-opposed measure at 3.49/5, with parking-to-pocket-forest conversion at 3.78. Expect friction on that specific lever, not on planting.
Note
The sample skews younger and better-connected than the city. Respondents aged 65+ are 509 of 7,329 (6.9%), against 21% of the actual population — the survey under-samples exactly the group the rest of this analysis identifies as most at risk. Self-reported AC (85%) also sits far above the census-modelled citywide figure (~60%). Read the survey for pattern and preference, not for population-level prevalence.
Loading…
RQ-G — Adaptive Capacity Versus Exposure
Education, income proxy and air-conditioning prevalence against heat exposure — testing whether the hottest districts are also the least able to cope.
Map layer: Higher education share under Vulnerability & census. Air-conditioning prevalence and the composite socioeconomic index are district-level tables, not yet published as map layers.
Method
Census 2021 education, occupation and unemployment per district, plus a modelled net-wage estimate and a modelled air-conditioning prevalence, combined into a composite socioeconomic index (0–1) for each of the 17 districts. Cross-referenced against this study’s own district UHI anomaly and against the citizen survey (RQ-F).
The wage column is a modelled proxy on a 2023 basis, derived from education structure — not measured income. Read it for ranking districts against each other, never as current absolute pay.
The counter-intuitive result
Richer districts in Zagreb run hotter, not cooler — socioeconomic index against district UHI anomaly gives r ≈ +0.40 (n=17). The mechanism is visible in the data rather than hidden in the correlation: the affluent historic core is the dense, low-vegetation fabric that produces the heat island.
| District | Socio-economic rank | Higher ed. | AC prevalence | ΔT |
|---|---|---|---|---|
| Gornji Grad – Medveščak | 1 | 60.6% | 60.3% | +3.0 °C |
| Donji Grad | 2 | 59.7% | 64.0% | +8.1 °C |
| Trešnjevka – sjever | 7 | 46.7% | 67.7% | +8.3 °C |
| Peščenica – Žitnjak | 13 | 32.1% | 58.7% | +5.8 °C |
| Sesvete | 14 | 21.7% | 48.7% | 0.0 °C |
| Donja Dubrava | 17 | 21.9% | 56.2% | +4.2 °C |
A “target the poorest districts” framing would miss the two hottest districts in the city. This does not overturn the study’s equity findings — it means income is a separate, complementary dimension, not a substitute for the exposure-and-demography lens in RQ-A.
Two districts are hot and under-equipped
AC prevalence tracks heat exposure citywide (r ≈ 0.70) — the hot, dense core also has newer housing stock. Two districts break the pattern: Peščenica – Žitnjak (ΔT +5.8 °C in 2026, AC 58.7%) and Donja Dubrava (ΔT +4.2 °C, AC 56.2%) sit above the citywide heat threshold with below-average cooling capacity, and rank #13 and #17 of 17 on the socioeconomic index. Three independent signals — exposure, economic standing, and home cooling — converge on the same two districts.
District averages hide the households that matter
Affluence at district level does not mean affluence at household level, and this is where a “Donji Grad is rich, so it can cope” reading breaks down:
| Group (survey) | n | Working AC | Vulnerability score | Income hardship |
|---|---|---|---|---|
| All respondents | 7,329 | 85.5% | 0.22 | 38.0% |
| Donji Grad, all | 539 | 83.0% | 0.25 | 37.6% |
| Donji Grad, aged 65+ | 82 | 70.4% | 0.46 | 47.5% |
| Citywide, 65+ and income hardship | 237 | 66.5% | 0.54 | 100% |
At the district level, Donji Grad’s own household income-hardship rate (37.6%) now tracks the citywide mean (38.0%) almost exactly — at wave 1 it ran slightly above it. The subgroup that matters is still there: Donji Grad’s residents aged 65+ report hardship at 47.5%, ten points above the district’s own average, alongside the lowest AC ownership and the highest vulnerability score of any Donji Grad subgroup. The affluent hot core still contains a least-buffered subgroup — the district-wide average just isn’t the number that reveals it; the age cut is.
Podsljeme: cool and green does not mean wealthy
Podsljeme is the coolest district in Zagreb by a wide margin (−3.6 °C, NDVI 0.81) and ranks only #10 of 17 on the socioeconomic index — solidly mid-table, with the second-lowest modelled air-conditioning prevalence in the city (50.3%). Living somewhere environmentally desirable and being affluent are not the same thing here. Worth remembering before assuming that green, cool neighbourhoods are the well-off ones, or that the affluence–heat correlation runs cleanly in every direction.
Planning takeaway
Keep RQ-A’s exposure-and-demography composite as the primary targeting lens. Use capacity as a second filter that changes what you build, not where: in high-capacity hot districts the gap is public-realm shade for the people who cannot retreat indoors; in low-capacity hot districts (Peščenica – Žitnjak, Donja Dubrava) the gap includes cooling capacity itself.
Loading…
RQ-H — Which Lever to Pull, Where
Heat Risk Population Index and geographically weighted regression across all 218 neighbourhoods, splitting risk into climate-driven and demography-driven, plus surface-versus-air decoupling.
Map layers: Heat Risk Population Index (HRPI), GWR local β, GWR local R², Heat-risk dominant driver and Thermal-risk intervention priority under Vulnerability & census; Surface–air coupling zones and LST vs TAIR hot-spot overlap under Baseline.
Method
Adaptations of Bečić & Gašparović’s Atmosphere 17, 466 and Earth 7(3), 72 models to Zagreb’s 218 mjesni odbori, using Census 2021 rather than the papers’ 2001–2024 change series. HRPI is the mean of four min–max normalised components per neighbourhood: 2 m air temperature, land-surface temperature, demographic sensitivity (DSI), and population density. A geographically weighted regression (27-neighbour adaptive kernel) then estimates, locally for each neighbourhood, how much of its heat risk is attributable to demographic sensitivity rather than to the climate signal itself.
Separately, Getis-Ord Gi* identifies statistically significant surface- and air-temperature hotspots, and a coupling classification flags where the two diverge.
HRPI distribution — all 218 neighbourhoods
Mean 0.512, median 0.515, range 0.141 (Gračani) – 0.756 (Hrvatski narodni vladari). This part of the model covers every neighbourhood, and it agrees directionally with the RQ-A vulnerability index: Hrvatski narodni vladari tops both, and Podsljeme’s hillside neighbourhoods anchor the bottom of both.
The intervention-targeting columns — read the coverage caveat first
The dominant driver and priority class attributions are the reason this analysis exists: read together they say which lever to pull, where. A critical hotspot that is demography-driven needs interventions aimed at the people already living there — shade, water, cooling refuges, outreach timed to the local age structure. A climate hotspot that is climate-driven needs the vegetation and surface work the rest of this study argues for.
But both attributions come from the GWR, and the GWR fits only 192 of the 218 neighbourhoods. The reason is upstream of the model: those 26 neighbourhoods have no Landsat land-surface sample in summer 2025, so they have no LST value, no local regression coefficients, and no fit. Until September 2026 all 26 were labelled climate-driven by default rather than left unclassified, which inflated that class by nearly half:
| Dominant driver | As first published | Among the 192 fitted |
|---|---|---|
| Demography-driven | 163 (74.8%) | 163 (84.9%) |
| Climate-driven | 55 (25.2%) | 29 (15.1%) |
| of which unfitted defaults | 26 | — |
| Priority class | As first published | Among the 192 fitted |
|---|---|---|
| Stable | 129 | 108 |
| Climate hotspot | 34 | 29 |
| Demographic sensitive | 34 | 34 |
| Critical hotspot | 21 | 21 |
The 21 critical hotspots and the 34 demographic-sensitive neighbourhoods are all fitted, so those two classes are usable as they stand. The climate-hotspot class is 29, not 34.
The data now carries the fitted figures. The classification was corrected in September 2026: unfitted neighbourhoods return no label, they are flagged as unfitted, and they render in neutral grey on the dashboard rather than taking the colour of a class they were never assigned to. On that basis roughly six in seven neighbourhoods with a usable local fit have their heat risk attributed mainly to demographic sensitivity rather than to the climate signal.
What this cannot support
The 26 unfitted neighbourhoods are not peripheral — they include Andrija Medulić (Donji Grad), August Cesarec (Gornji Grad – Medveščak), Cvjetnica (Trnje), Donje Svetice and Folnegovićevo naselje. They are disproportionately inner-city, which is what a Landsat sampling gap in the dense historic core would produce.
Until September 2026 they also carried no district label — a merge artefact, since the district was present in the source all along under a different column. That made any district-level breakdown of drivers unusable: crosstabs silently dropped 26 central neighbourhoods and gave the rest a default label. An earlier reading of this data concluded that Donji Grad has no climate-driven neighbourhoods; that was an artefact, not a finding. The district join is now repaired, but the underlying sampling gap remains: those 26 neighbourhoods still have no local fit, so a driver breakdown covers 192 of 218 and should say so. Recovering LST for the inner-city core is the outstanding work.
Surface versus air: exactly one hotspot on both
This part uses a separate model and covers all 218 neighbourhoods. Of them, 21 are significant surface-temperature hotspots and 13 are significant air-temperature hotspots. Exactly one — Rudeš, in Trešnjevka – sjever — is a significant hotspot on both at once, matching the ≈0.5% share the source paper found.
The actionable class is the 20 surface-hot-only neighbourhoods: surface-hot but air-decoupled, where the satellite sees a hot surface that the local air model does not. Surface treatments — cool roofs, lighter pavement, shading a specific hot surface — are likely to matter more there than general ambient cooling. They include Antun Mihanović, Dr. Ante Starčević, Ciglenica and Donja Kustošija (Trešnjevka – sjever / Stenjevec), Kralj Zvonimir and Kralj Petar Svačić (Donji Grad), and Marin Držić and Martinovka (Trnje) — largely the same inner-core neighbourhoods RQ-A already flags, but reclassifying why.
Coupling zones citywide: coupled 124 (57%), air above expected 51 (23%), air below expected 43 (20%). Citywide surface–air correlation is r = 0.589, close to the source paper’s ≈0.54.
Caveats
- GWR local fit: mean R² 0.827, median 0.893 across the 192 fitted neighbourhoods. Where local R² is low the specification does not explain local variation well, and the priority class should not be used for targeting at those specific locations.
- HRPI itself covers all 218 neighbourhoods, including the 26 without an LST sample — so for those, the index rests on three of its four components. Treat their HRPI values as less certain than the rest.
- Air temperature comes from a ~9 km reanalysis grid, so “decoupled” partly reflects model resolution rather than only physical decoupling.
- Census 2021 is a single snapshot; the source papers used a 2001–2024 change series, so this is a cross-sectional adaptation, not a replication.
- HRPI and the RQ-A index are two legitimate but different ways of ranking the same 218 neighbourhoods. They agree at the extremes and have not been reconciled in between.
Loading…
RQ-I — What the Tree Cadastre Can and Cannot Tell Us
162,676 individually registered trees joined to districts: a maintenance register rather than a canopy layer, and a stock too young to shade much yet.
Map layers: Green Cadastre (Trees) and Green Cadastre (Tree Density) under Greenery.
Method
Zagreb’s zeleni katastar records 162,676 individual trees across 240 species, each with a height class, crown and trunk diameter class, and a coordinate. Every tree was joined to its city district by point-in-polygon — all 162,676 matched, none dropped — then normalised by district area and compared against this study’s own heat anomaly and NDVI.
The register is not a canopy layer
Cadastred-tree density correlates positively with heat and negatively with greenness:
| Measure | vs. heat anomaly | vs. NDVI |
|---|---|---|
| Trees per km² | r = +0.70 | r = −0.76 |
| Mature trees (≥16 m) per km² | r = +0.67 | r = −0.67 |
The hottest, least-green districts have the most registered trees. Podsljeme — the greenest (NDVI 0.81) and coolest (−3.6 °C) district in Zagreb — holds just 577 cadastred trees, 10 per km², of which 85% are under 5 m. Brezovica has 745. Trnje has 2,287 per km².
There is no contradiction: the cadastre registers municipally managed street and park trees, so it maps where the city plants and waters, not where canopy exists. Podsljeme’s cooling comes from hillside forest and private gardens that no municipal register contains.
This settles an open question. The project had wondered whether the cadastre was already the canopy-cover layer it planned to request from the city’s geoportal service. It is not — and substituting it for canopy cover would invert the relationship the rest of this study measures. What it is good for is different and still valuable: it is the inventory of the trees the city already owns, and therefore of what can be protected, pruned, watered through a heatwave, or replaced.
The stock is young
| Height class | Trees | Share |
|---|---|---|
| Under 5 m | 57,374 | 35.3% |
| 6–10 m | 47,788 | 29.4% |
| 11–15 m | 31,766 | 19.5% |
| 16–20 m | 17,013 | 10.5% |
| 21–25 m | 5,688 | 3.5% |
| Over 25 m | 2,670 | 1.6% |
Only 15.6% of registered trees — 25,371 of them — are 16 m or taller, and over a third are saplings under 5 m. Shade scales with crown size, so a third of the register delivers almost none today. The citywide mean height is 9.0 m.
Where the mature street canopy actually is
| District | Trees/km² | Mature/km² | Mature % | Mean height | ΔT |
|---|---|---|---|---|---|
| Trnje | 2,287 | 344 | 15.1% | 9.2 m | +6.5 °C |
| Novi Zagreb – istok | 1,381 | 317 | 22.9% | 10.4 m | +6.7 °C |
| Trešnjevka – jug | 2,338 | 283 | 12.1% | 8.7 m | +4.0 °C |
| Donji Grad | 1,894 | 257 | 13.5% | 8.6 m | +8.1 °C |
| Trešnjevka – sjever | 1,453 | 183 | 12.6% | 8.8 m | +8.3 °C |
| Stenjevec | 934 | 38 | 4.0% | 6.9 m | +5.7 °C |
| Sesvete | 40 | 2 | 6.3% | 6.8 m | 0.0 °C |
| Podsljeme | 10 | 0 | 0.3% | 3.4 m | −3.6 °C |
Two things follow. First, the inner ring already has the city’s densest mature street canopy and is still the hottest part of Zagreb — street trees alone have not closed the gap in dense historic fabric, which points at total canopy fraction and built form rather than tree count. Second, Stenjevec is the clearest anomaly: 934 trees per km², the fourth-densest register in the city, but only 4.0% mature and a mean height of 6.9 m. It has been planted recently and at scale, and will deliver far more shade in fifteen years than it does now.
Planning takeaway
Use the cadastre for stewardship, not for measuring canopy: which trees to protect from removal, which to prioritise for watering during a heatwave, and where recent planting still needs a decade to pay off. Measure actual canopy with NDVI (RQ-C) or a dedicated canopy layer. And treat “we planted N trees” as a statement about future shade — with 35% of the register under 5 m, planting counts and delivered cooling are years apart.
Loading…
RQ-J — Where Every Line of Evidence Agrees
Counting how many of six independent axes flag each district, and what changes when heat is no longer the only one.
Uses the layers behind RQ-A, RQ-F, RQ-G, RQ-H and the heatwave module together.
Method
This study now has six independent axes of evidence, built from different data by different methods:
- Daytime heat — district anomaly at or above the citywide hot threshold (+5.8 °C in 2026), from Landsat
- Heatwave days — the four districts with the most tropical-night heatwave days (RQ11)
- Lived burden — the five worst self-reported burden districts among those with a reliable survey sample (RQ-F)
- No street shade — the five worst street-shade ratings in the survey (RQ-F)
- Low socioeconomic standing — the five lowest on the composite index (RQ-G)
- Low cooling capacity — below-average air-conditioning prevalence while above the baseline for heat (RQ-G)
Plus a seventh marker: two or more HRPI critical hotspots inside the district (RQ-H).
Each district is scored by how many of these place it in the worst tier.
This counts breadth, not severity. A district with one flag can still carry the most extreme single value in the city — Donji Grad shows two flags and still holds five of the twenty-one critical hotspots. Some axes are also correlated: heatwave days and low AC coverage both track the eastern lowlands. Read the count as how many different kinds of evidence point here, never as a risk score.
The result (summer 2026)
| Flags | District | ΔT | What flags it |
|---|---|---|---|
| 4 | Trešnjevka – sjever | +8.3 °C | daytime heat · heatwave days · lived burden · no street shade |
| 4 | Peščenica – Žitnjak | +5.8 °C | daytime heat · lived burden · low income · low AC |
| 4 | Donja Dubrava | +4.2 °C | lived burden · no street shade · low income · low AC |
| 4 | Sesvete | 0.0 °C | no street shade · low income · low AC · 2 critical hotspots |
| 3 | Novi Zagreb – zapad | +5.2 °C | heatwave days · lived burden · no street shade |
| 3 | Gornja Dubrava | +1.4 °C | lived burden · low income · low AC |
| 2 | Donji Grad | +8.1 °C | daytime heat · 5 critical hotspots |
| 2 | Novi Zagreb – istok | +6.7 °C | daytime heat · heatwave days |
| 2 | Trnje | +6.5 °C | daytime heat · 3 critical hotspots |
| 1 | Stenjevec | +5.7 °C | 5 critical hotspots |
| 0 | Maksimir · Gornji Grad – Medveščak · Podsljeme | — | — |
What this changes
2026 lines up better than 2025 did. Trešnjevka – sjever moved from three flags to four and is now both the hottest district and the most broadly flagged — last summer those were different places. Peščenica – Žitnjak gained the daytime-heat flag as it entered the hot five.
But two of the four most-flagged districts still sit outside the daytime ranking entirely: Donja Dubrava at +4.2 °C and Sesvete at 0.0 °C. Both dropped from five flags in 2025 to four in 2026, and both stay in the top tier on evidence that has nothing to do with daytime surface heat.
The reason is mechanistic: the eastern lowlands lose heat slowly at night (RQ11’s tropical nights), have the weakest cooling capacity and the lowest incomes (RQ-G), and their residents report among the highest lived burden (RQ-F) — while their daytime surface temperatures are unremarkable because the fabric is lower-density.
Two distinct priority cases, not one ranking:
- Intensity, inner ring. Donji Grad, Trnje, Trešnjevka – sjever and Stenjevec carry the extreme daytime anomalies and 13 of the 21 HRPI critical hotspots between them.
- Breadth, eastern lowlands. Peščenica – Žitnjak, Donja Dubrava, Sesvete and Gornja Dubrava are flagged by more axes each, driven by night-time heat retention, low adaptive capacity and lived experience.
Trešnjevka – sjever is the only district in the top tier of both — a stronger argument for its pilot status in 2026 than it was in 2025.
The four unflagged districts
Maksimir, Gornji Grad – Medveščak and Podsljeme clear all six axes in 2026. Podsljeme is genuinely the cool green reference. The other three warrant a caveat rather than an all-clear: Gornji Grad – Medveščak has four neighbourhoods above 30% elderly share, 7,563 residents aged 65+, and declining greenness, District-level axes miss neighbourhood-level concentrations — see the coverage caveat in RQ-A.
Planning takeaway
Report both cases and say which one a given intervention serves. Daytime-surface measures — shade, cool pavement, canopy — belong in the inner ring where the anomaly is extreme. Night-time measures — permeable surfaces, green roofs, reducing stored heat — plus cooling-capacity support belong in the east, where five of six axes converge and the daytime map shows almost nothing.
Loading…
RQ-K — Summer 2025 Versus Summer 2026
Both measured summers side by side: 2026 was warmer in the air, flat at the surface, and its extra surface heat landed outside the historic core.
Dashboard: most heat layers carry a Summer year toggle (2025 / 2026), defaulting to 2026.
Which numbers are comparable, and which are not
Three district-level figures for 2025 are in circulation. They differ because of sample basis, not because the weather was re-measured:
| 2025 figure for Donji Grad | Source | Status |
|---|---|---|
| +9.64 °C | 5,000-pixel Landsat sample (original May 2026 run) | Superseded — what the site published until September 2026 |
| +9.07 °C | 8,000-pixel sample, matched to 2026 | Current — the whole site, charts and dashboard now use this |
| +8.20 °C | A mis-sourced intermediate file | Withdrawn |
None of these is “wrong.” The sample gives Donji Grad only 12 pixels, so its anomaly carries a 95% bootstrap confidence interval of [+8.23, +9.88] °C — and the originally published +9.64 sits inside it. The two valid figures are statistically indistinguishable; the difference is sampling noise on a very thin district, not a change in the weather or a corrected error. The site was moved onto the 8,000-pixel basis in September 2026 so that the narrative, the charts and the dashboard all agree and 2025 can be compared with 2026 directly. Quote it as “about +9 °C”.
For scale, the sampling intervals on the other hot districts:
| District | Pixels | ΔT 2025 | 95% CI |
|---|---|---|---|
| Donji Grad | 12 | +9.07 | [+8.23, +9.88] |
| Trešnjevka – sjever | 41 | +8.85 | [+8.51, +9.20] |
| Trnje | 37 | +7.04 | [+6.18, +7.83] |
| Stenjevec | 67 | +6.06 | [+5.13, +6.93] |
| Novi Zagreb – istok | 93 | +5.59 | [+5.13, +6.06] |
| Podsljeme | 320 | −3.50 | [−3.92, −3.07] |
The ranking is robust — Donji Grad and Trešnjevka – sjever are clearly the two hottest in 2025, and clearly ahead of Trnje. The second decimal is not, and any statement that two districts differ by less than about half a degree is inside the noise.
The third value briefly appeared in the 2025 summary data, but it had been computed from the 2026 intermediate rather than the 2025 one, and that intermediate reconciles with neither summer’s measurements (about 2.4 °C from both). It was a sourcing error rather than a corrected measurement, and it also put Maksimir into the 2025 hot-district set in place of Stenjevec. The 2025 figures have since been rebuilt from the 8,000-pixel 2025 sample using the identical method as 2026 — anomaly against the rural-class mean, hot threshold at the 75th percentile — and the rebuild restores the originally published five hot districts.
Everything below uses the matched 8,000-pixel basis: the two summers share 7,982 of 7,988 sample locations, so the same ground is differenced and Donji Grad rests on the same 12 pixels in both years.
2026 was an air event, not a surface event
| Measure | 2025 | 2026 | Change |
|---|---|---|---|
| Air temperature, median neighbourhood | 27.47 °C | 28.56 °C | +1.06 °C |
| Apparent temperature | 28.95 °C | 30.26 °C | +1.30 °C |
| Neighbourhoods warmer | — | — | 100% of 218 |
| Surface LST, matched pixels | 33.18 °C | 33.52 °C | +0.34 °C |
| Surface − air gap | 7.72 °C | 6.36 °C | −0.97 °C |
| Citywide NDVI | 0.702 | 0.687 | −0.015 |
Air temperature rose in every one of the 218 neighbourhoods, by +0.82 to +1.47 °C. Surface temperature barely moved, and only 58% of pixels were warmer. The gap between what satellites see and what people breathe closed by about a degree.
That has a delivery consequence: a summer hotter in the air but flat at the surface rewards shade, ventilation and cool refuges more than albedo and pavement treatments.
The heat island narrowed — which is not progress
Built-up-minus-rural contrast fell from +6.42 to +6.19 °C, because the cool surfaces warmed far faster than the built ones:
| Land cover | Pixels | ΔLST | ΔNDVI |
|---|---|---|---|
| Water | 64 | +1.14 | +0.001 |
| Grassland | 1,851 | +0.53 | −0.023 |
| Trees | 4,245 | +0.35 | −0.018 |
| Built-up | 828 | +0.13 | −0.020 |
| Cropland | 977 | +0.07 | +0.015 |
Water warmed nine times as much as built-up. The rural reference itself rose +0.36 °C. A falling UHI intensity here means the cooling reservoir is losing ground, not that the heat island is weakening — anyone quoting it as an improvement has the sign backwards.
The extra surface heat landed outside the historic core
| District | ΔT 2025 | ΔT 2026 | Change | ΔLST |
|---|---|---|---|---|
| Trešnjevka – sjever | +8.85 | +8.27 | −0.59 | −0.23 |
| Donji Grad | +9.07 | +8.13 | −0.95 | −0.59 |
| Novi Zagreb – istok | +5.59 | +6.69 | +1.10 | +1.45 |
| Trnje | +7.04 | +6.53 | −0.52 | −0.16 |
| Peščenica – Žitnjak | +4.88 | +5.80 | +0.92 | +1.28 |
| Stenjevec | +6.06 | +5.72 | −0.34 | +0.02 |
| Novi Zagreb – zapad | +4.55 | +5.24 | +0.70 | +1.05 |
| Maksimir | +4.33 | +3.84 | −0.48 | −0.12 |
| Sesvete | +1.17 | +0.01 | −1.16 | −0.80 |
| Podsljeme | −3.50 | −3.59 | −0.09 | +0.27 |
Trešnjevka – sjever (+8.27 °C) is the hottest district in 2026, overtaking Donji Grad (+8.13 °C). The historic core’s surface actually cooled slightly, while Novi Zagreb – istok (+1.45 °C), Peščenica – Žitnjak (+1.28 °C) and Novi Zagreb – zapad (+1.05 °C) took the warming.
This is the same direction the rest of the study now points in. Those are lower-density, more vegetated districts — consistent with the land-cover breakdown above — and Peščenica – Žitnjak is already flagged on four independent axes in RQ-J. The 2026 data strengthens the case that the eastern and southern districts, not only the historic core, belong in the priority frame.
The hot-district set is a moving target
| Year | The five | Threshold |
|---|---|---|
| 2025 | Donji Grad · Novi Zagreb – istok · Stenjevec · Trešnjevka – sjever · Trnje | +5.59 °C |
| 2026 | Donji Grad · Novi Zagreb – istok · Peščenica – Žitnjak · Trešnjevka – sjever · Trnje | +5.80 °C |
Membership is a within-year 75th percentile, so a district can cross the line without its own temperature moving much — and the threshold itself rose from +5.59 to +5.80 °C. Stenjevec left; Peščenica – Žitnjak joined. The 2025 set is the same five originally published, which is a useful independent check on the rebuild described above.
Heatwaves: the sharpest change of all
Recomputed for both summers on one basis — station-calibrated ERA5-Land at all 218 neighbourhood centroids. The 2025 figures reproduce the originally published values, which validates the method.
| Measure | 2025 | 2026 |
|---|---|---|
| City-wide heatwave events | 3 | 6 |
| Heatwave days per neighbourhood, median | 15 | 32 |
| Heatwave days, range | 0–23 | 7–38 |
| Neighbourhoods with no heatwave | 5 | 0 |
| Tropical nights per neighbourhood, mean | 29.0 | 43.9 |
Median heatwave days more than doubled, tropical nights rose by half, and every neighbourhood had at least a week of heatwave conditions in 2026 against five with none in 2025.
This is the finding that ties the rest together. A summer that is +1 °C in the air, flat at the surface, and carries 50% more tropical nights is a nocturnal heat event — which is exactly what the surface−air gap closing by 0.97 °C describes. It also reinforces RQ11’s original conclusion: heatwave burden is set by night-time cooling capacity, and it concentrates in the eastern lowlands.
One caveat on the method: the station bias correction is year-specific by design (+0.91 °C for 2025, +0.53 °C for 2026), so it is calibration rather than a uniform shift. On the uncorrected ERA5 basis the direction is identical and the relative gap is wider still (median 7 → 23 days).
Two year-flips that look dramatic and are not
- Elderly heat-exposure scores fell (0.180 → 0.170; night version 0.145 → 0.089) while air temperature rose everywhere. These are normalised within each year, so the map can look cooler in a hotter summer. Always read them beside an absolute layer.
- Night surface temperature appears to jump +1.8 °C, but rests on 2 usable ECOSTRESS scenes in 2025 against 6 in 2026 — different nights, not two comparable summer means.
Planning takeaway
Two summers is a difference, not a trend. Report 2026 as warmer in the air, flat at the surface, greener nowhere, and warming fastest outside the historic core — and keep the 2025 column alongside it. For direction over time, the multi-year series in RQ-E remains the right instrument.
Loading…
Loading…
Loading…
Loading…
Limitations
- The main heat metric is land-surface temperature, not air. Air adds three reference stations and a coarse citywide model — not a dense monitoring network.
- Neighbourhood air differences on the map are small; the elderly exposure layer ranks air and combines it with census age structure.
- Not every neighbourhood has a paired land-surface sample in either summer; some statistics use subsets. Donji Grad's district anomaly rests on only 12 sampled pixels, so it carries roughly ±0.8 °C.
- Station averages are not the same as peak heatwave hours — use hot-day percentiles for “how hot it felt” messaging.
- Night surface results use only two clear July satellite passes; neighbourhood values average whole areas (parks, water, and buildings together).
- Census is from 2021; satellite and weather from 2026, with 2025 shown alongside.
- Small districts with few sample points are less statistically stable — though the Donji Grad signal is strong enough that conclusions hold.
- Cycling data does not cover every district equally (e.g. gaps for Podsljeme and Brezovica).
- The citizen survey is self-selected, not representative. Residents aged 65+ are 6.9% of the sample against 21% of the population, and self-reported air conditioning (85%) sits well above the census-modelled citywide figure (~60%). It skews younger and better-connected than Zagreb.
- The survey burden index spans only 2.77–3.07 across 16 districts, with first place 0.005 ahead of second. It is not usable as a district ranking; street shade (2.37–3.57) is the item with real spread. Brezovica (n=34) is excluded from all survey rankings and correlations as too small to rank.
- Self-reported burden is not the same as health risk. Residents aged 65+ rate their burden below average (2.86 vs. 2.97) while scoring roughly double on vulnerability (0.42 vs. 0.22), because the burden index is dominated by commuting, work and outdoor leisure that retirees do less of.
- Socioeconomic indicators — including air-conditioning prevalence and the composite index — exist only at district level (17 units), not per neighbourhood, so they cannot be joined to the 218-neighbourhood heat layers. Estimated net wage is modelled from education structure on a 2023 basis, not measured income; read it as a relative ranking only.
- Health data is monthly and district-level, which cannot resolve the 3–5 day heat-mortality window, and the 2020–2021 mortality peak is COVID-19. No heat–health link is demonstrated for Zagreb here.
- RQ-C's greenness figures are district-level. The 38 screened neighbourhoods share only seven distinct NDVI values between them, so that ranking separates districts, not neighbourhoods. Its hectares-of-canopy conversion returned values larger than the neighbourhoods themselves and has been withdrawn pending recalibration.
- RQ-H's driver attribution covers 192 of 218 neighbourhoods. The 26 without a local GWR fit are labelled climate-driven by default, which inflates that class in the raw data, and they carry no district label — so district-level driver breakdowns are not usable, and the fitted figures should be quoted instead.
- The convergence count in RQ-J measures breadth, not severity, and some of its axes are correlated (heatwave days and low air-conditioning both track the eastern lowlands). It is a prompt to look, not a risk score.
- The tree cadastre is a municipal street-tree register, not a canopy inventory, and its height data is six ordinal classes rather than measured heights. Neighbourhood-level survey aggregates have a median of only 32 respondents (99 of 184 reach 30), so the district cut is the reliable one.
- The city dataset contains only 10 drinking fountains across all 17 districts. Fountain-coverage findings measure that dataset as much as the ground.
- Only 22.7% of residents aged 65+ live inside the 32 hot-and-dense neighbourhoods, so that frame is a heat-exposure shortlist rather than a map of where vulnerable people live.
Glossary
| Term | Meaning |
|---|---|
| Urban heat island (UHI) | Built-up areas hold more heat than greener or rural surroundings. |
| Land-surface temperature | Temperature of ground, roofs, and pavements from satellite — not the air people breathe. |
| Heat anomaly (ΔT) | How much warmer or cooler a place is than a green/rural reference. Positive = hotter than reference. |
| Vegetation index (NDVI) | Satellite measure of greenness; higher values mean more vegetation. |
| Gradska četvrt | One of Zagreb’s 17 city districts. |
| Mjesni odbor (MO) | One of 218 local neighbourhoods — finest level with census data. |
| GUP | General urban plan, including official green zones used as a cool reference. |
| Elderly heat exposure score | Combines share aged 65+ with ranked modelled daytime air on the map. |
| Heatwave (DHMZ-style) | ≥3 consecutive days with daily max ≥30 °C and daily min ≥20 °C (tropical night). |
| UHEI | Urban Heat Exposure Index: LST + (1−NDVI) + (1−Albedo), range 0–3. Follows the TALEA (Bologna) methodology. |
| LST Z-Score | Statistical anomaly: (pixel LST − city mean) / city std. Blue = cooler than average, red = hotter. |
| ECOSTRESS | NASA instrument on the space station; finer but irregular land-surface temperature. |