Data and Methods
What each map layer shows, which data it uses, and how it was prepared for Zagreb. On the dashboard, the ! button opens a short version of the same notes.
No layers match that search.
Baseline (citywide heat)
10-
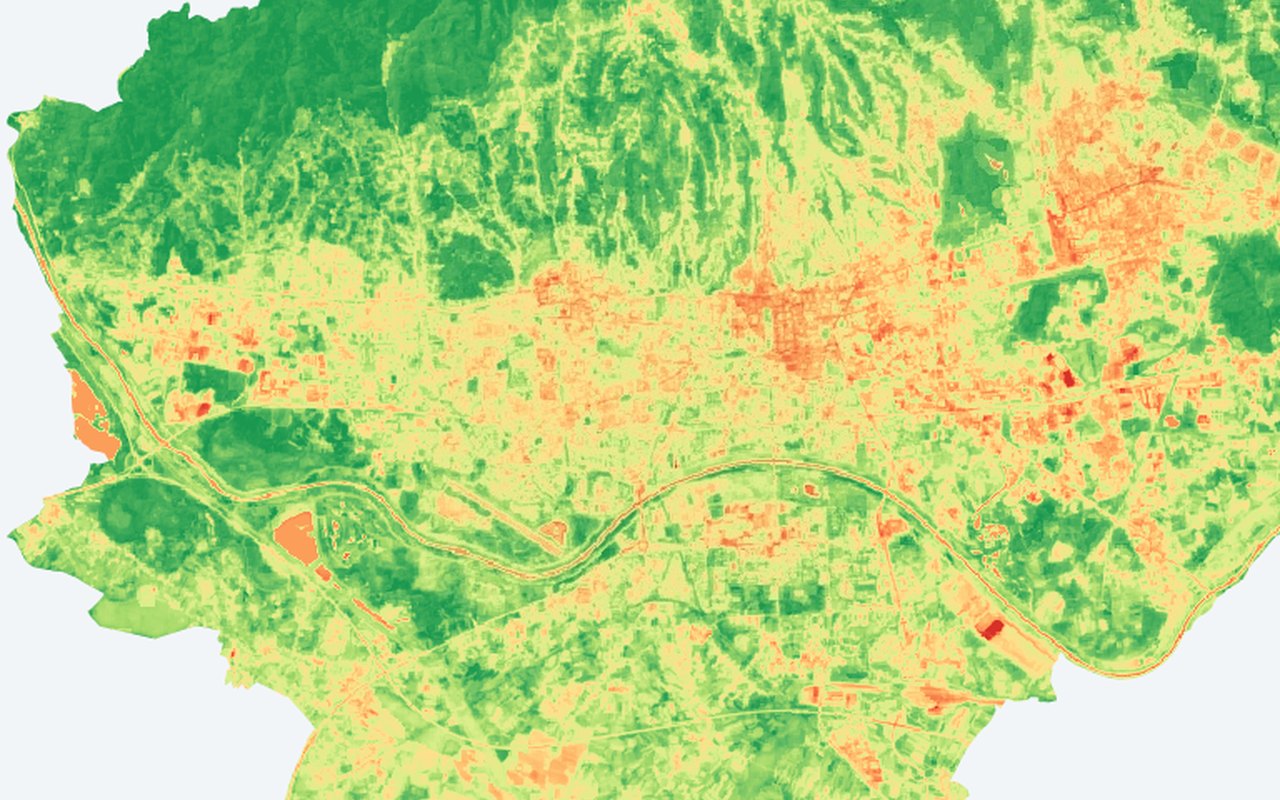
Land surface temperature
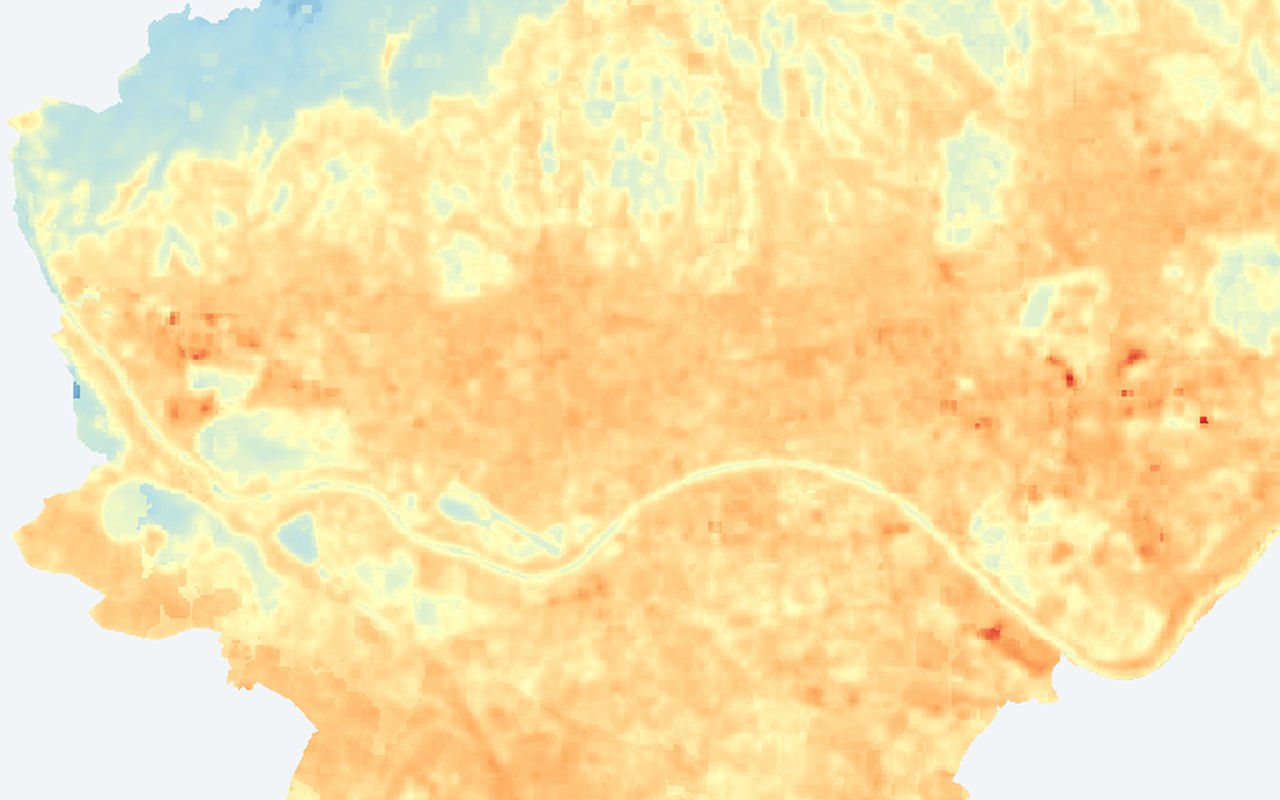
A citywide map of summer land surface temperature — how hot roofs, streets, parks, and other surfaces appear from space. Warmer colours mark hotter surfaces; cooler colours mark greener or more open areas.
-
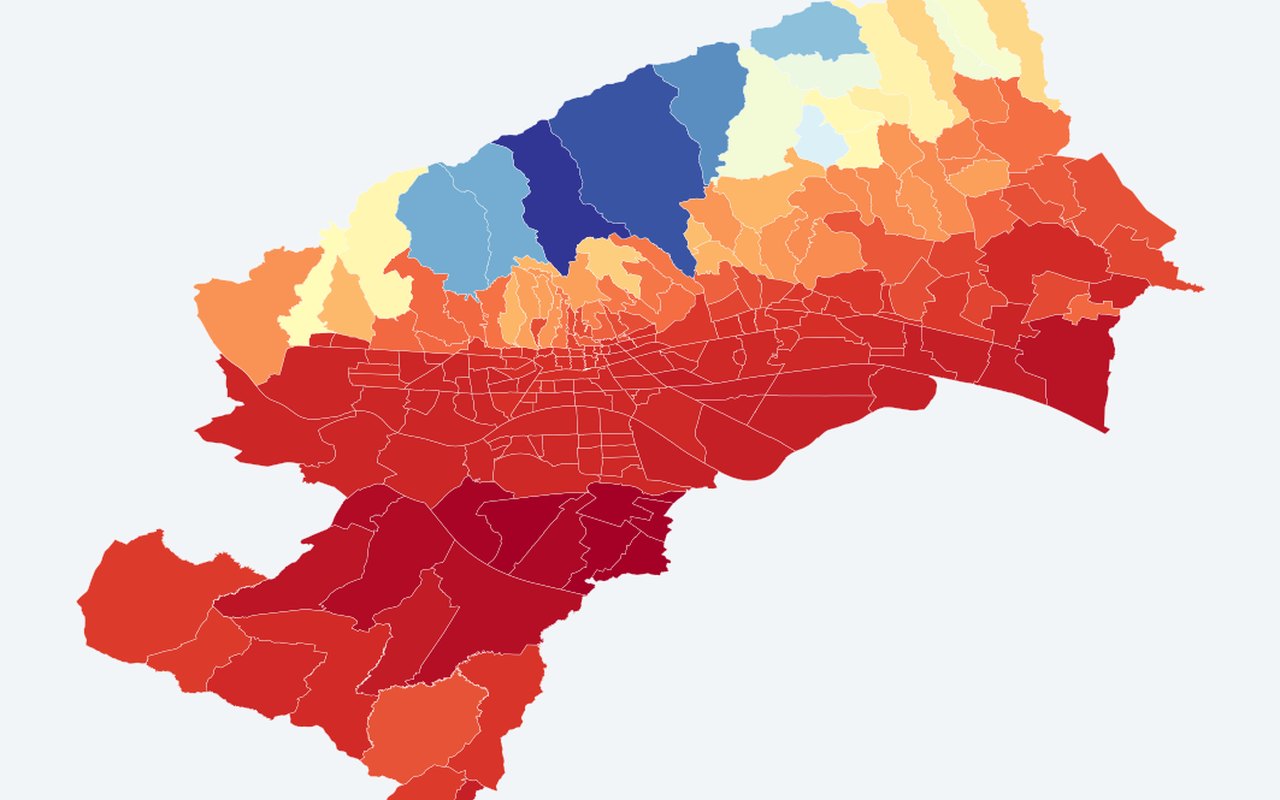
ECOSTRESS LST composite (~70 m)
Daytime land surface temperature from NASA ECOSTRESS at roughly 70 m detail — finer than classic Landsat thermal, useful for spotting hot corridors inside the city.
-
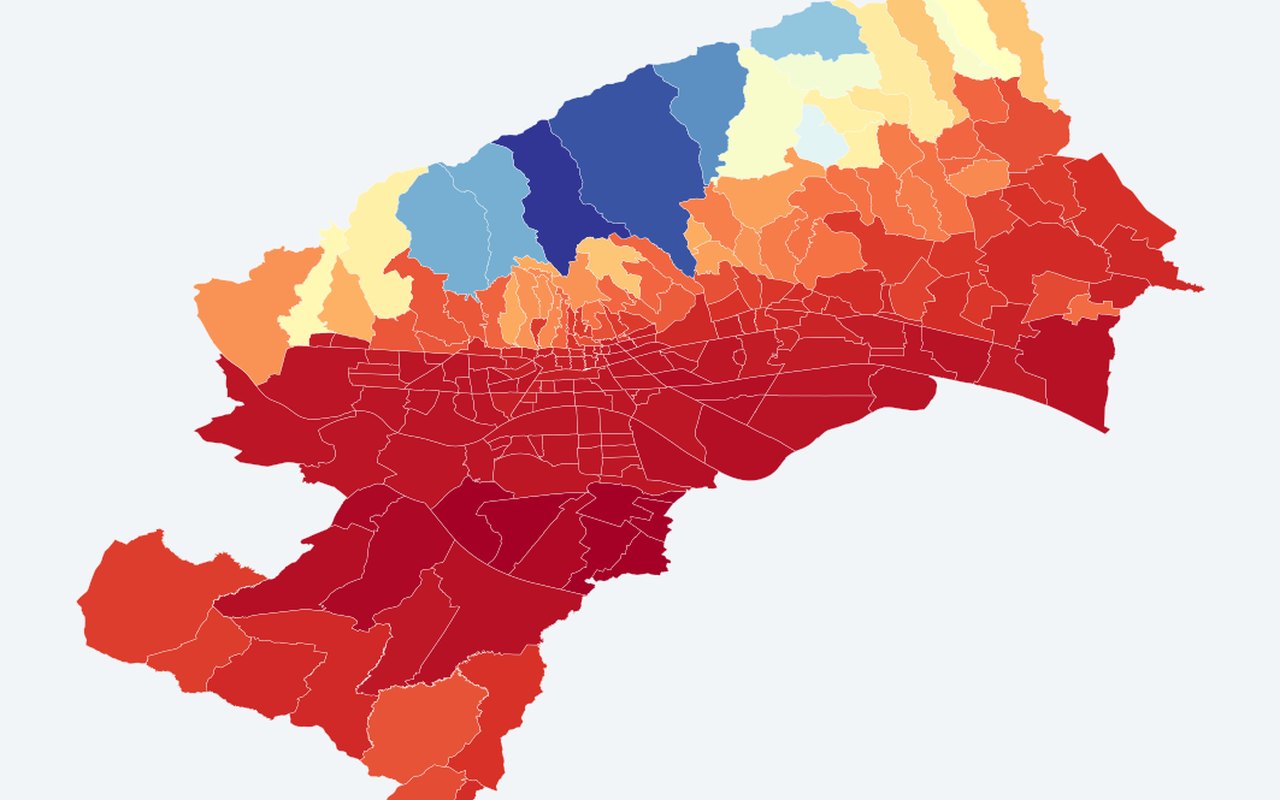
ECOSTRESS night LST composite (~70 m)
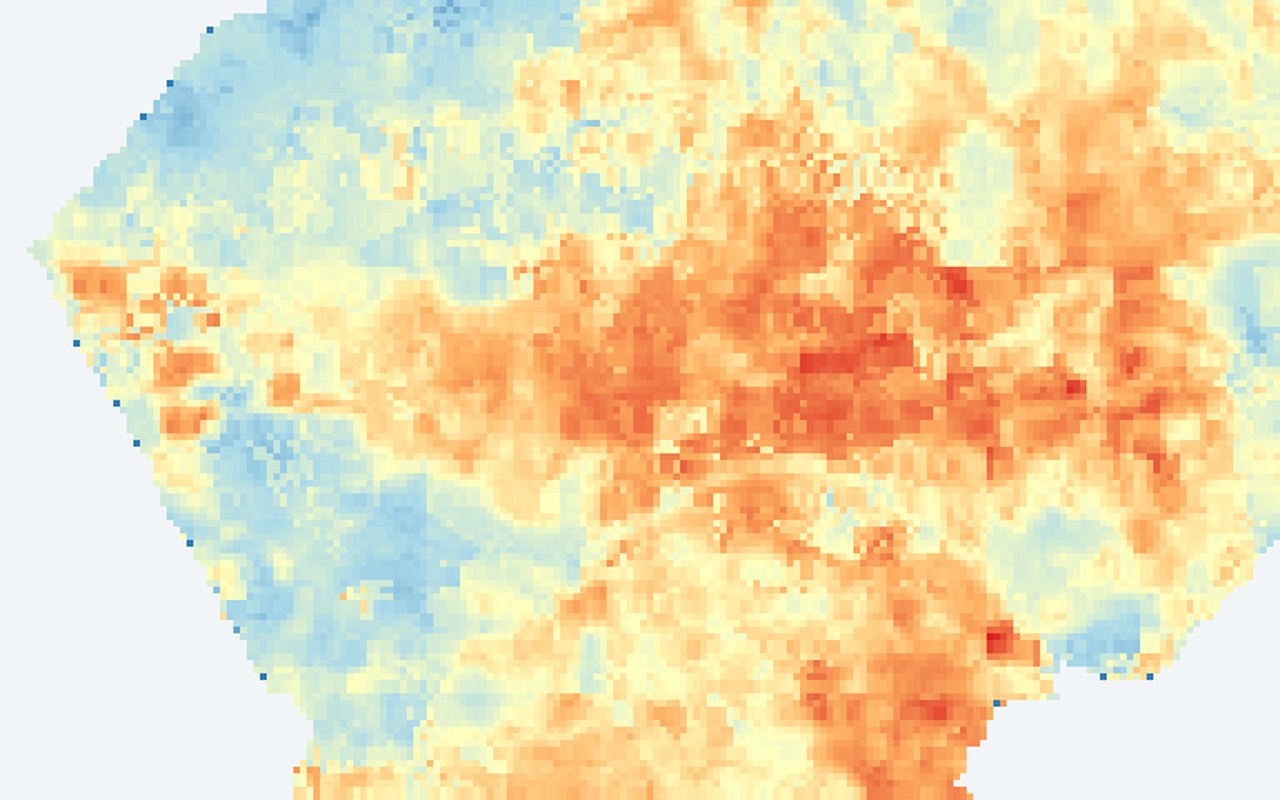
Night-time land surface temperature from ECOSTRESS, showing where the city stays warm after sunset.
-
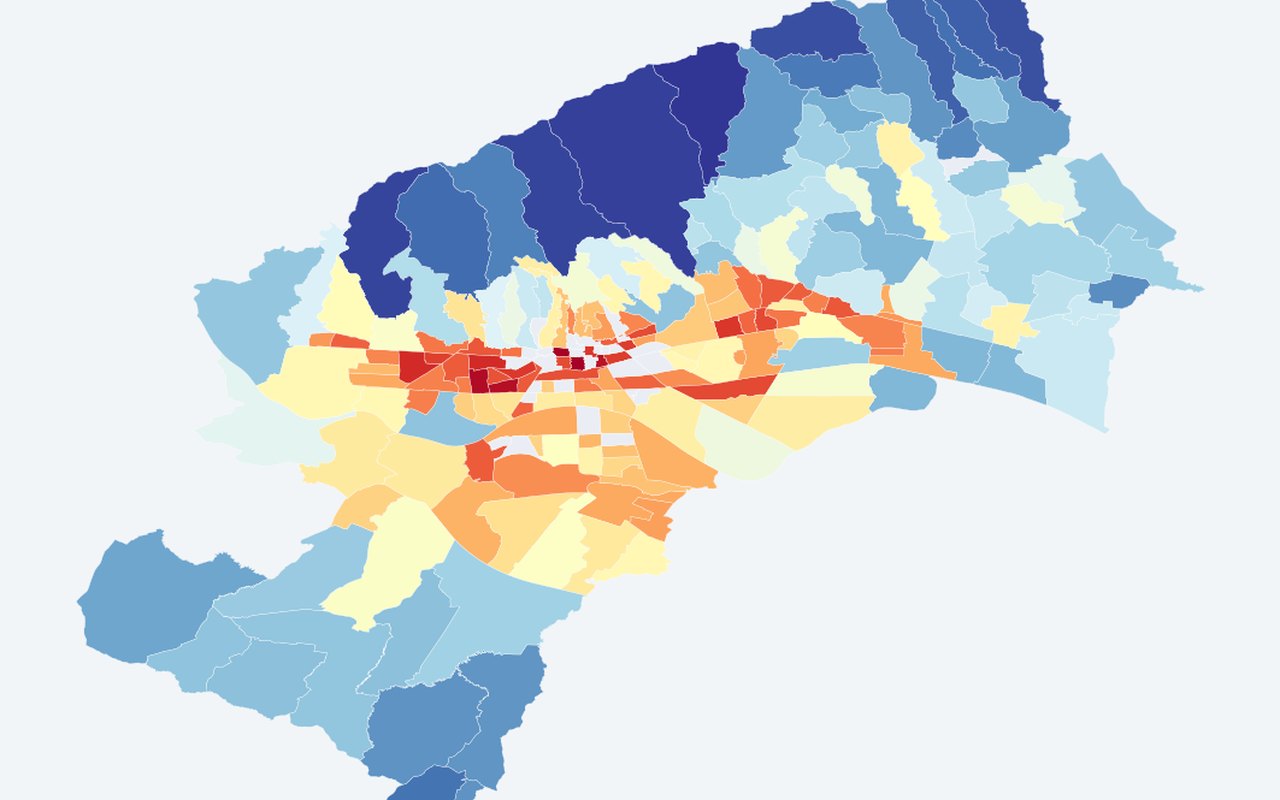
ECOSTRESS night LST — MO (°C)
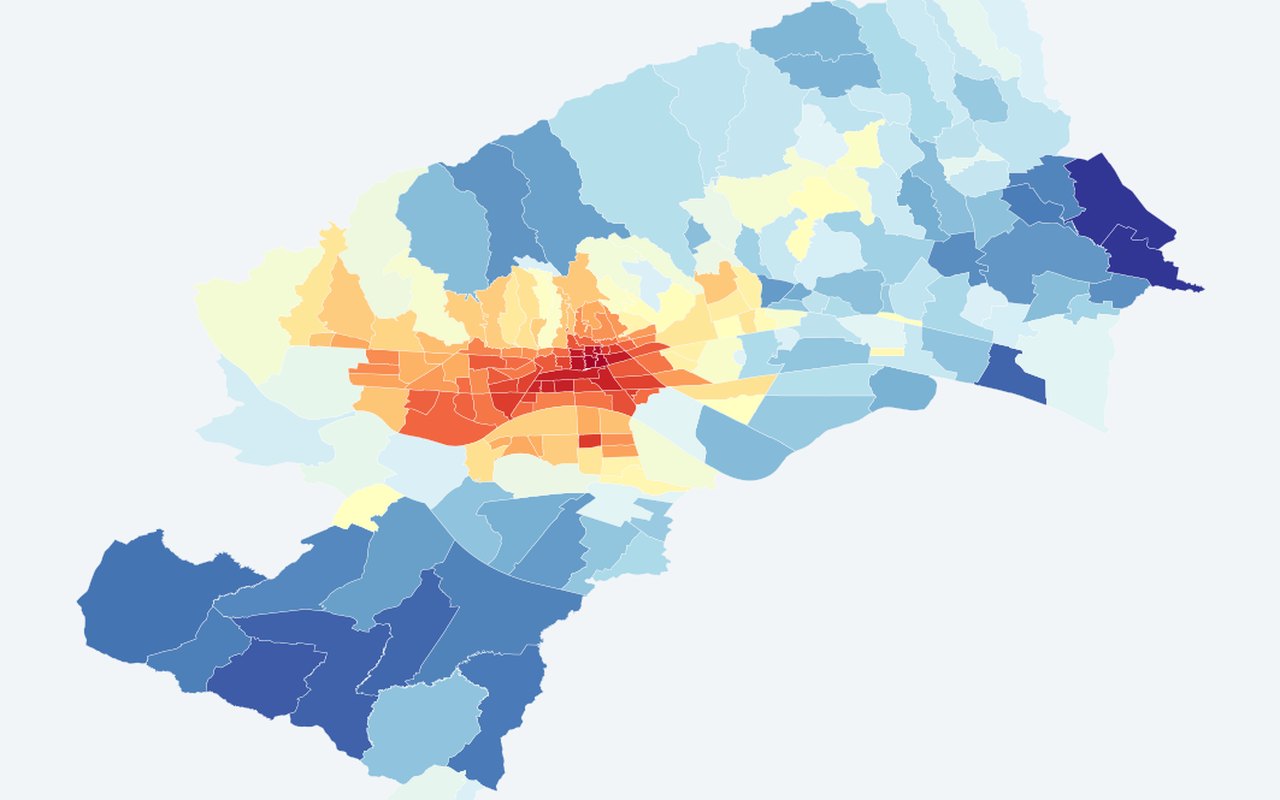
Average night-time land surface temperature for each Zagreb neighbourhood, showing which areas stay warmer after dark.
-
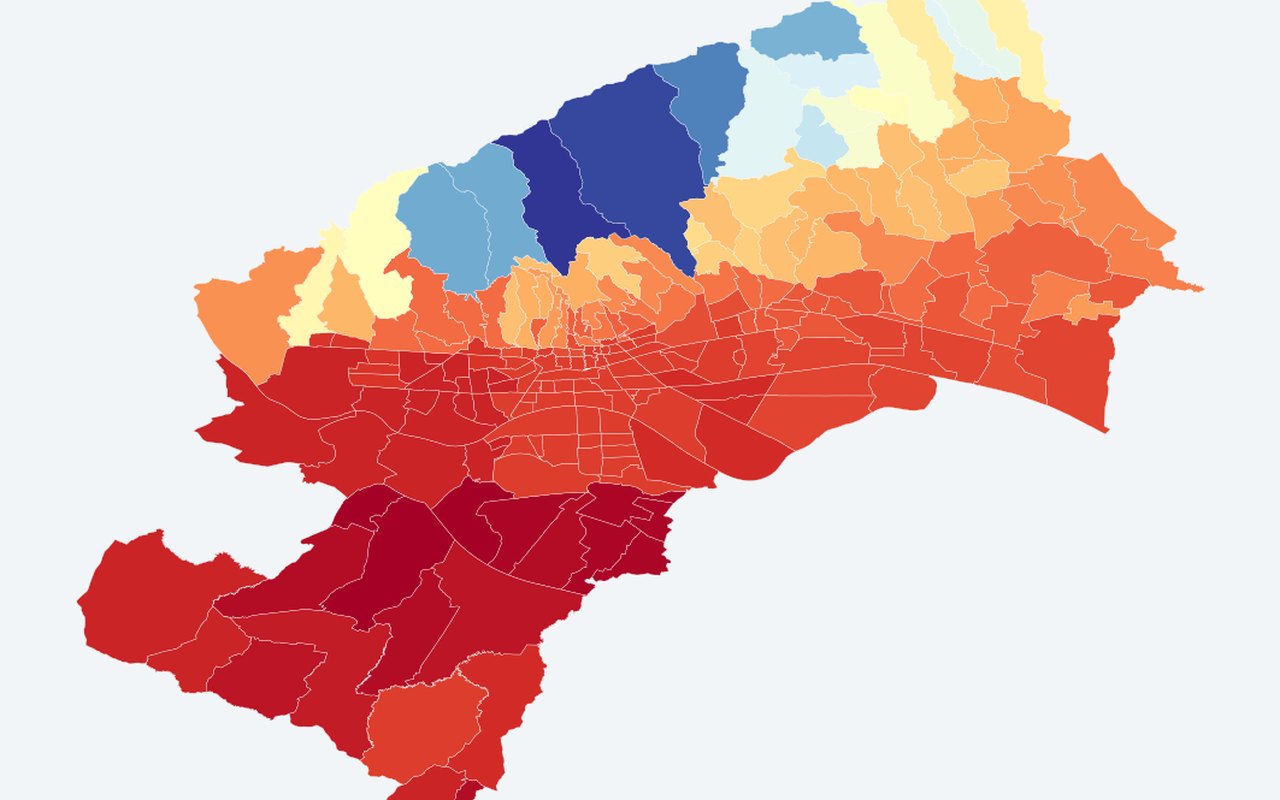
Estimated 2 m air temperature — MO (°C)
neighbourhood choropleth of bias-corrected reanalysis / station-calibrated 2 m air (°C). Station-calibrated modelled air temperature by neighbourhood.
-
Estimated apparent temperature — MO (°C)
neighbourhood choropleth of estimated apparent temperature (°C). Apparent (feels-like) temperature by neighbourhood from air-temp calibration.
-
LST — MO polygons (Summer 2024, Atmosphere 2026)
Mean Landsat 8/9 land surface temperature (°C) per neighbourhood from the paper's 2024 acquisition window. Higher = hotter surface.
-
Near-surface air temperature — MO (Summer 2024, Atmosphere 2026)
Mean 2 m air temperature (°C) at ~11:00 CEST on each 2024 Landsat date, averaged across acquisitions (ERA5-Land via Open-Meteo).
-
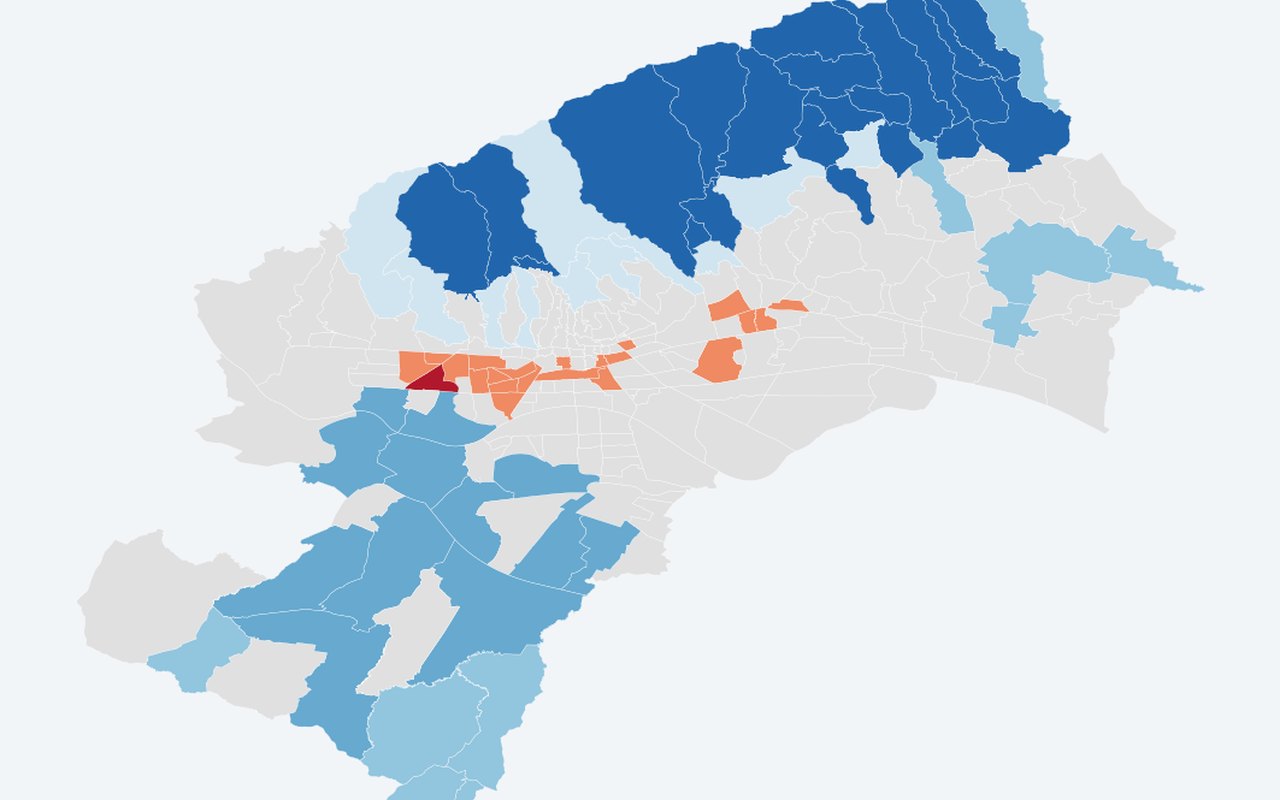
Surface–air coupling zones (Atmosphere 2026)
regression air temperature~land surface temperature residuals: coupled (|z|≤0.5 SD), air temperature above expected (warm air vs surface), air temperature below expected (ventilation/cool drainage).
-
LST vs TAIR hot-spot overlap (Atmosphere 2026)
Getis–Ord Gi* cross-tabulation: both hot/cold, land surface temperature-only, air temperature-only, or not significant (α=0.05).

Satellite rasters
13-
NDVI (Vegetation)
(NIR − Red) / (NIR + Red); higher = greener / more photosynthesis. Landsat vegetation greenness vegetation index tiles.
-
NDBI (Built-up)
(SWIR − NIR) / (SWIR + NIR); higher = more built / impervious surface. Landsat built-up intensity built-up index tiles.
-
Elevation
Above-sea-level elevation (m). Elevation / DEM tiles.
-
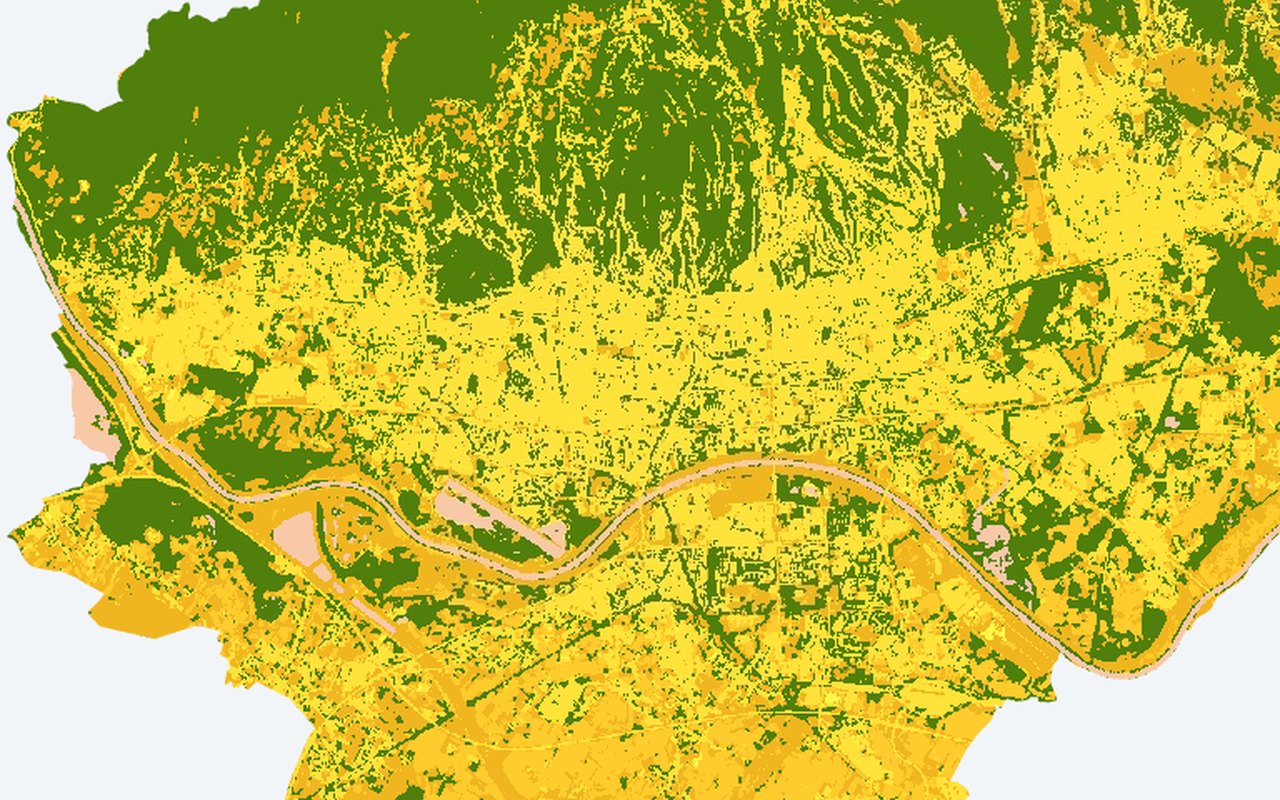
Land Cover
ESA WorldCover 10 m classes (built-up, trees, cropland, water, …). Land-cover classification tiles.
-
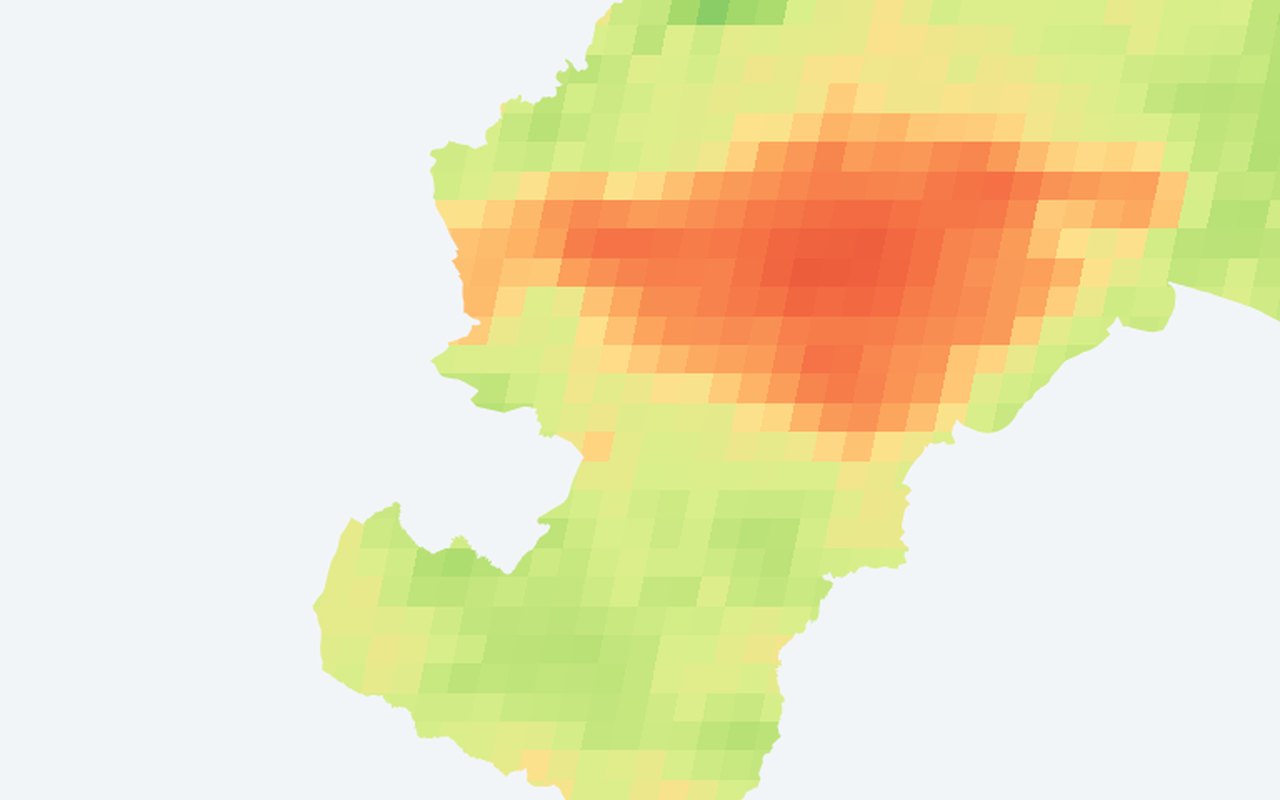
MODIS Nighttime LST (°C)
Mean nighttime land surface temperature from MODIS, averaged over summer. Warm nights (red, 24–28 °C) = heat retained overnight → dangerous for health because the body cannot recover from daytime heat stress. Cool nights (green, 12–16 °C) = effective cooling, typically vegetated/elevated areas. Resolution is ~1 km (neighbourhood scale).
-
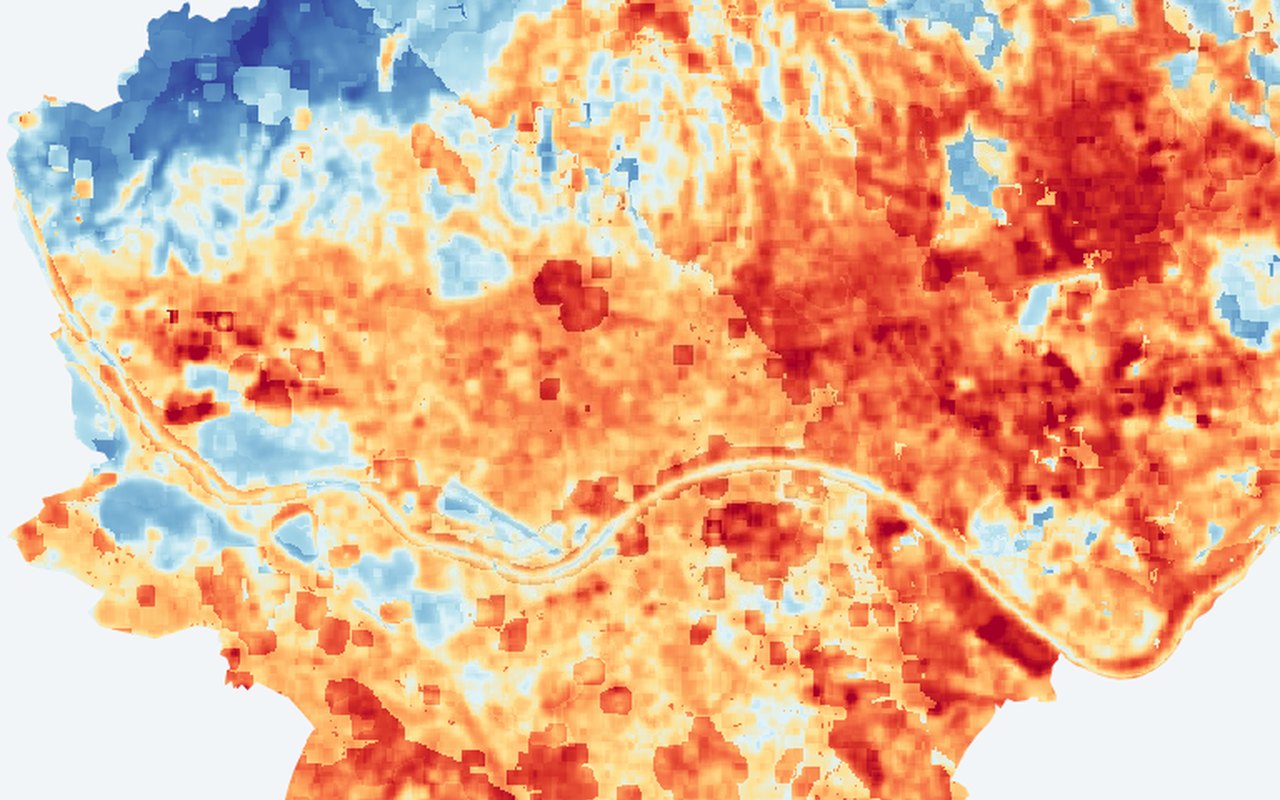
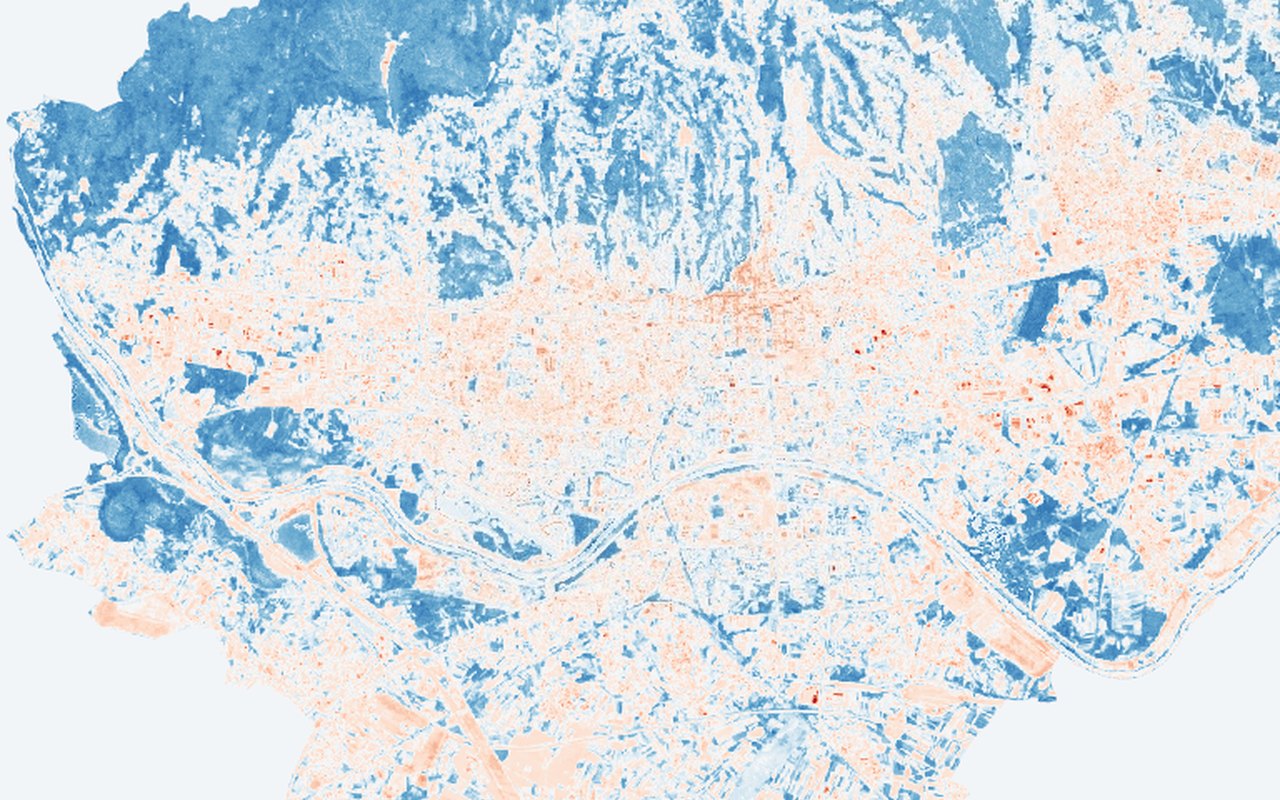
LST Z-Score (Anomaly)
Z = (pixel land surface temperature − city mean land surface temperature) / city std-dev. Blue (negative Z) = cooler than average; red (positive Z) = hotter than average. A pixel at 35 °C in a city averaging 38 °C appears blue (cool spot) even though 35 °C is hot in absolute terms. Useful for identifying local anomalies that absolute temperature maps miss — e.g. a warm pocket inside a park.
-
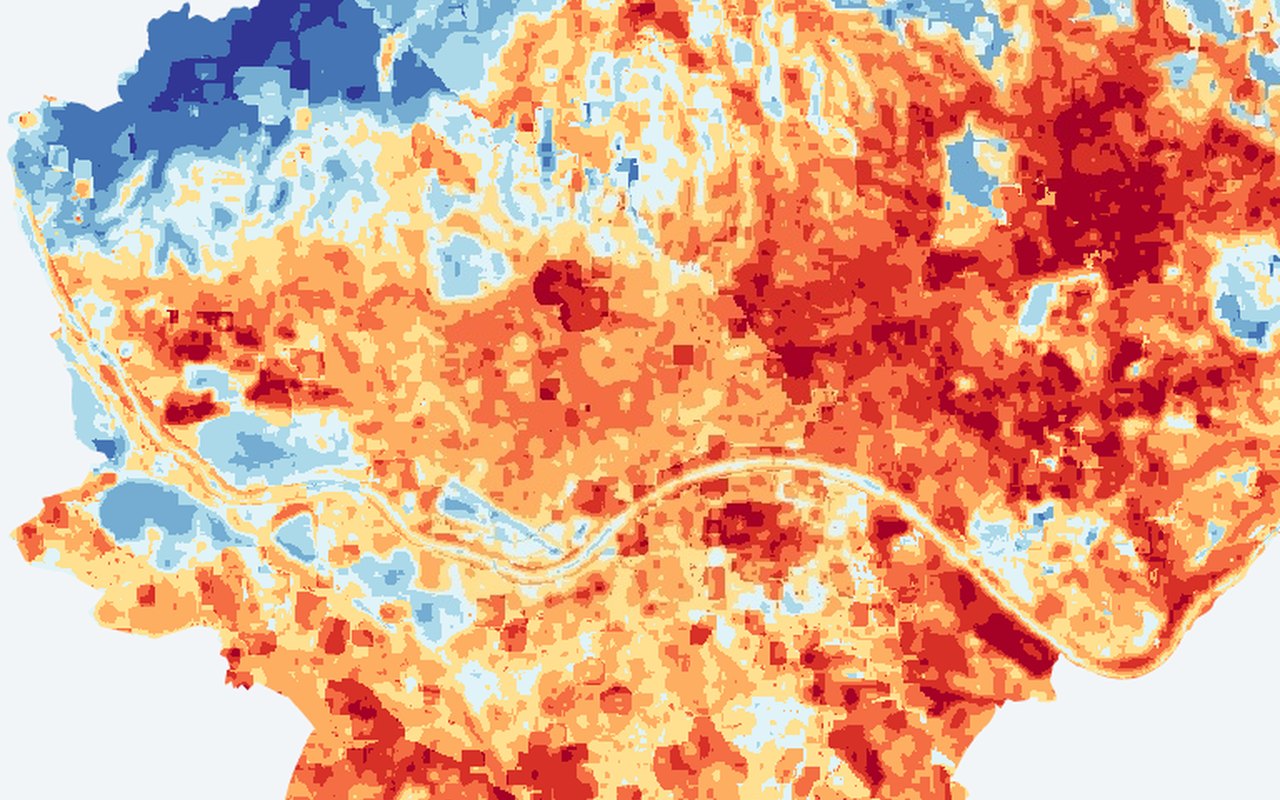
LST Z-Score Classes (1-10)
10 fixed classes from extreme cold spot (class 1, Z ≤ −2.0) to extreme hot spot (class 10, Z > 2.0). Middle classes (5–6) are near-average. Class 1–4: progressively cooler than average. Class 7–10: progressively hotter than average. Simpler to interpret than continuous Z values — hand this to a policy maker and say 'red = act here'.
-
Urban Heat Exposure Index (UHEI)
UHEI = LST_norm + (1 − NDVI_norm) + (1 − Albedo_norm). Range: 0 (best) to 3 (worst). Green (low UHEI) = cool, vegetated, reflective surfaces. Red (high UHEI) = hot, bare, dark surfaces — where all three risk factors stack up. Differs from the Composite UHI Index (temperature minus vegetation greenness) by adding albedo as a third dimension: captures surface material reflectivity that vegetation greenness alone misses (e.g. light vs dark parking lots score differently).
-
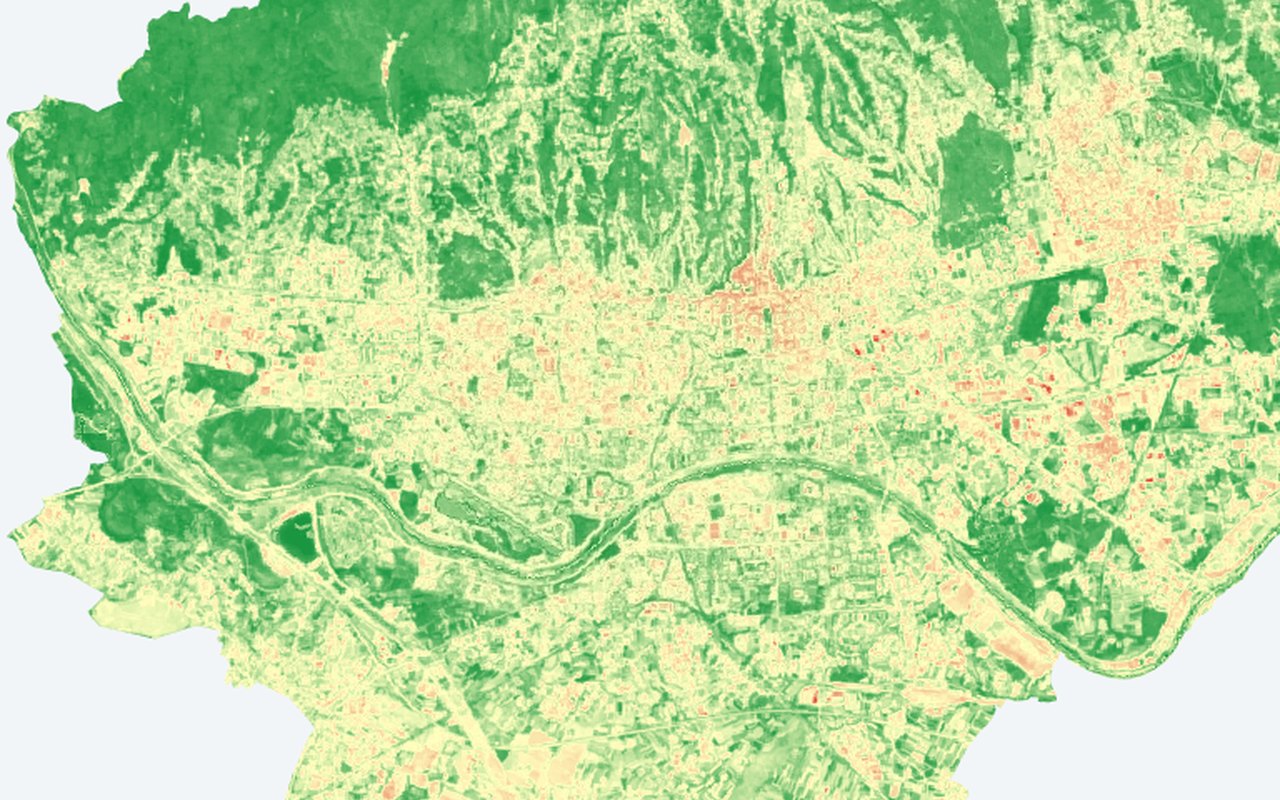
Sentinel-2 NDVI (10 m)
Normalized Difference Vegetation Index at 10 m from Sentinel-2 MSI. Dark green (vegetation greenness > 0.6) = dense healthy vegetation (parks, forests). Yellow (0.2–0.4) = sparse vegetation or irrigated turf. Red (< 0.1) = bare soil, asphalt, or water. Compare side-by-side with the 30 m Landsat vegetation greenness to see block-level detail that coarser imagery misses — individual tree canopies, courtyards, green roofs.
-
Sentinel-2 NDBI (10 m)
Normalized Difference Built-up Index. Red (built-up intensity > 0.1) = dense built-up or bare soil. Blue (built-up intensity < −0.2) = vegetation or water. Higher built-up intensity correlates with higher land surface temperature — use this to identify heat-driving surfaces.
-
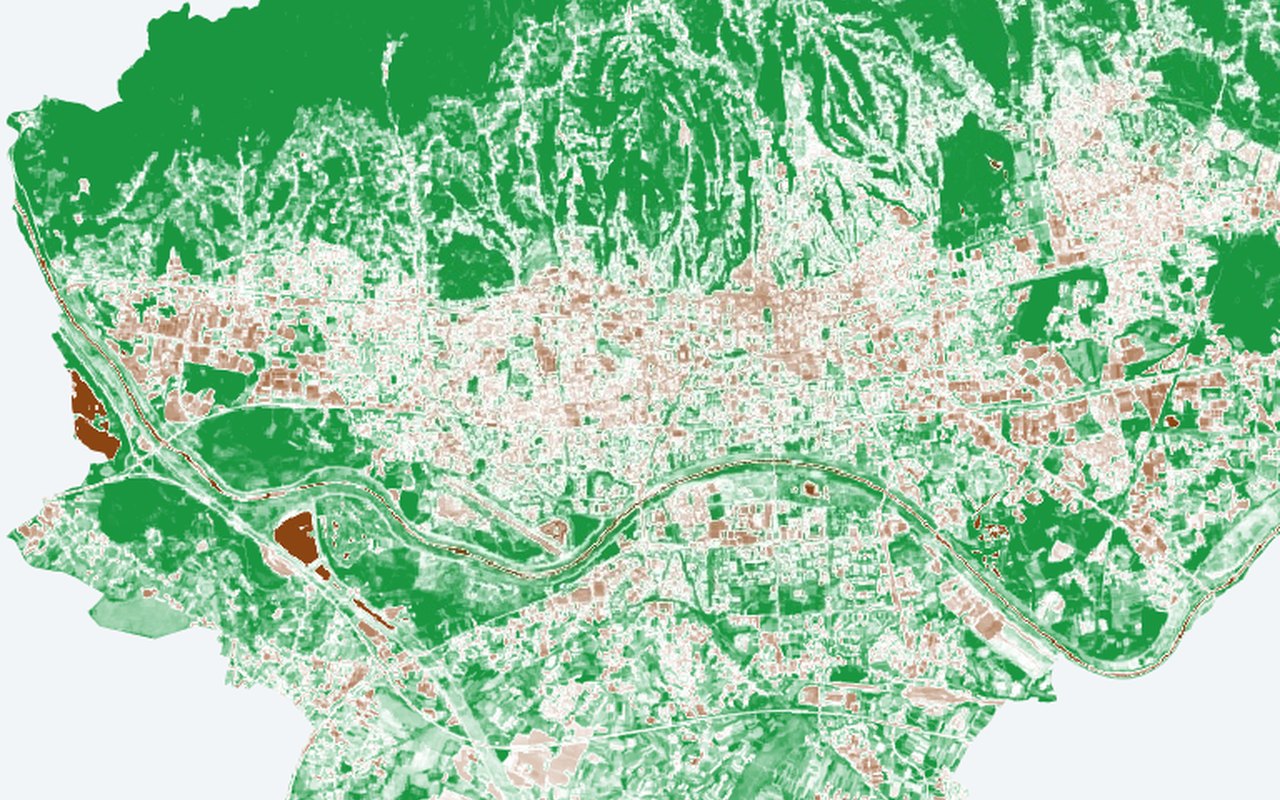
Sentinel-2 NDWI (10 m)
Normalized Difference Water Index. Blue/green (NDWI > 0) = open water or saturated soil. Brown (NDWI < −0.3) = dry, built-up surfaces. Water bodies act as urban cooling sinks; visualize their extent at higher resolution.
-
Sentinel-5P NO₂ (TROPOMI)
Citywide nitrogen dioxide (NO₂) from satellite — a pollution backdrop that often follows traffic corridors and industrial areas.
-
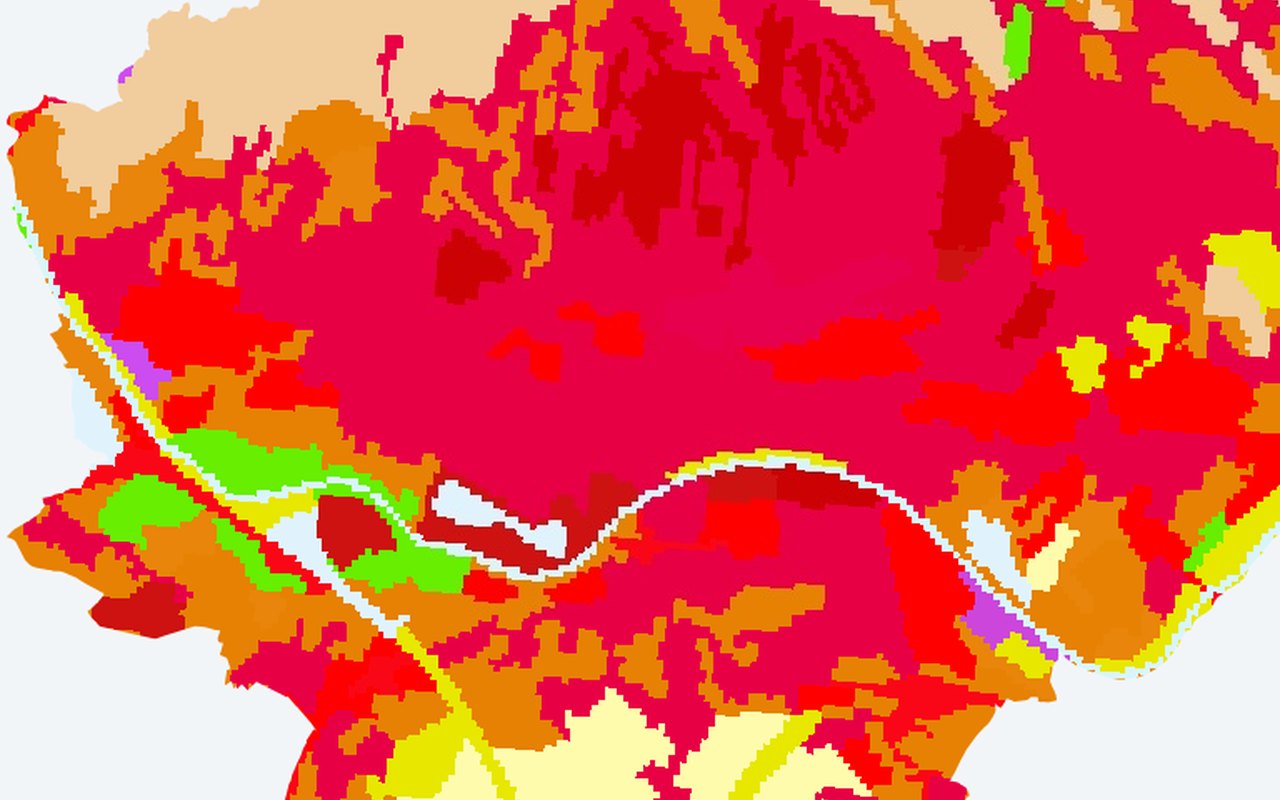
CORINE Land Cover (100 m)
CORINE Level-3 land cover classification (100 m). Distinguishes continuous urban fabric (111) from discontinuous (112), industrial (121), road/rail (122), ports (123), airports (124), construction (133), green urban areas (141), sport/leisure (142), arable (211), vineyards (221), forests (311–313), wetlands, water bodies, and more. Ideal for correlating land-use CLASS (not just cover) with UHI intensity — e.g. 'industrial zones are 3 °C hotter than discontinuous residential'.




Findings
8-
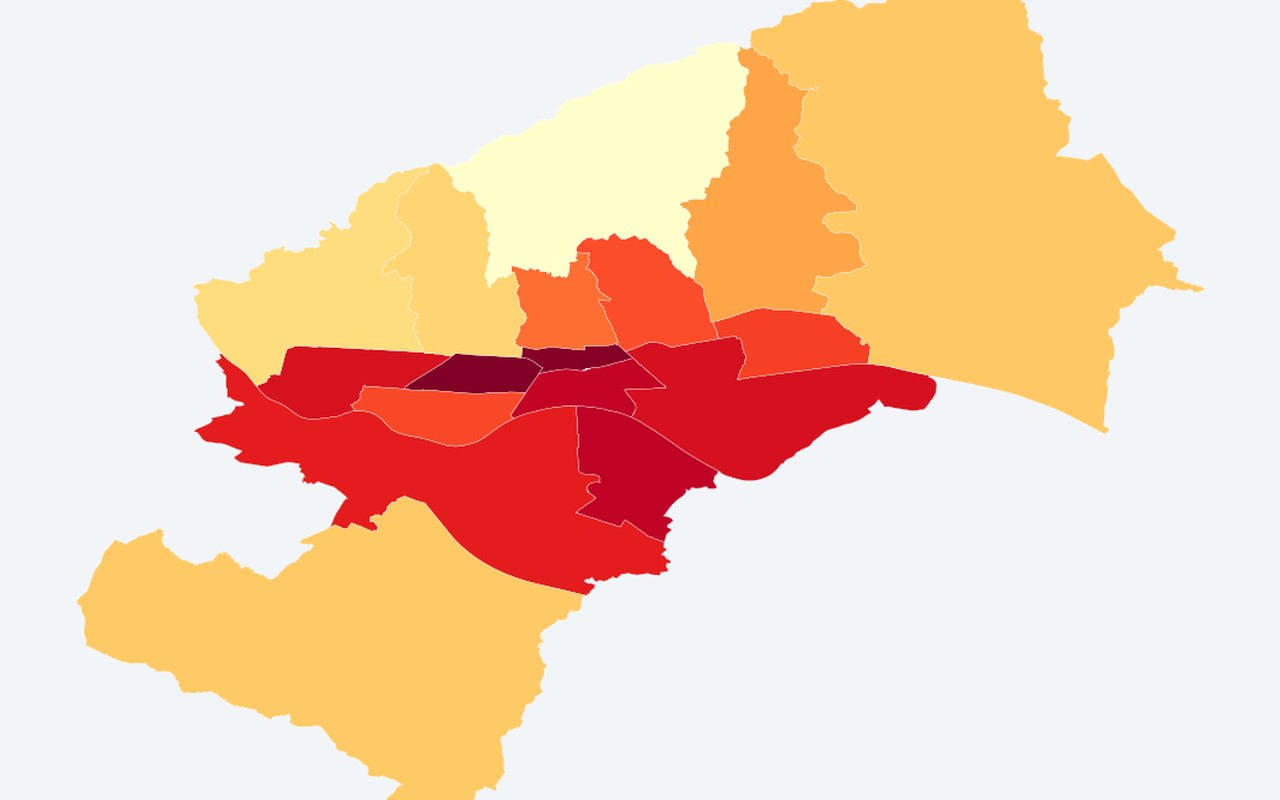
UHI Anomaly per Neighborhood (ΔT °C)
Mean land surface temperature minus a rural reference (WorldCover non-urban classes). Positive = hotter than rural. District mean land surface temperature minus rural reference.
-
Mean LST per Neighborhood (°C)
Mean Land Surface Temperature (°C) over the analysis window. District mean land surface temperature.
-
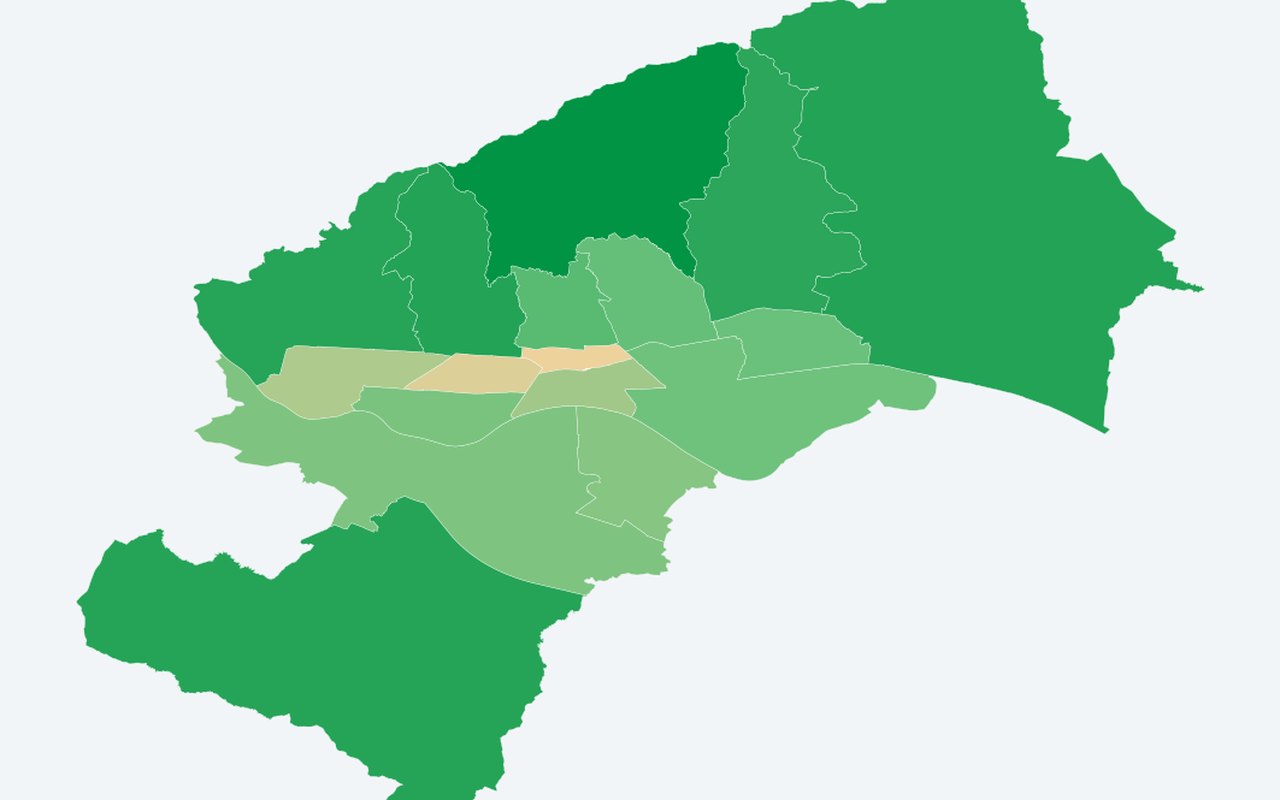
Mean NDVI per Neighborhood (Greenness)
Mean vegetation greenness per polygon (range −1 to +1, higher = greener). District mean vegetation greenness (greenness).
-
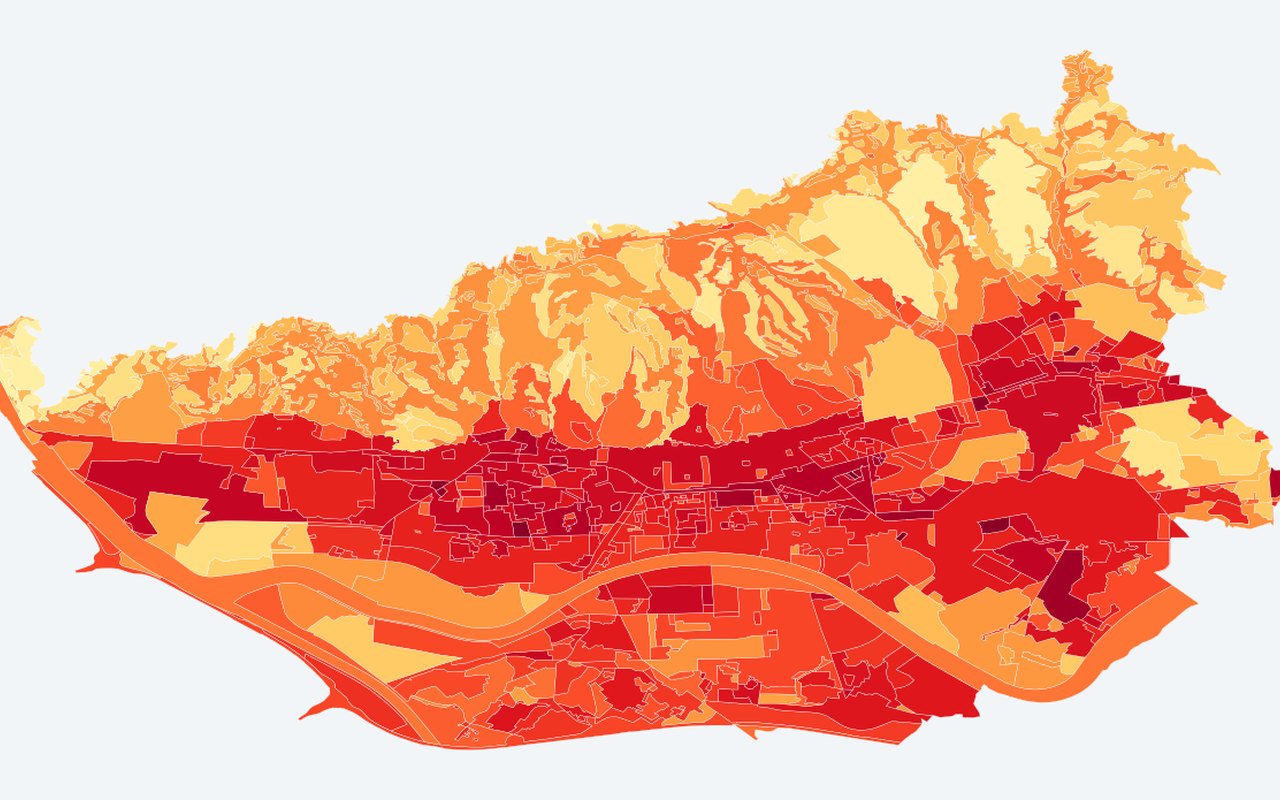
Composite UHI Index (MDPI)
A published-style composite urban heat index that combines surface temperature with vegetation greenness on Zagreb planning polygons. Higher values mean a stronger heat-island signature in index space.
-
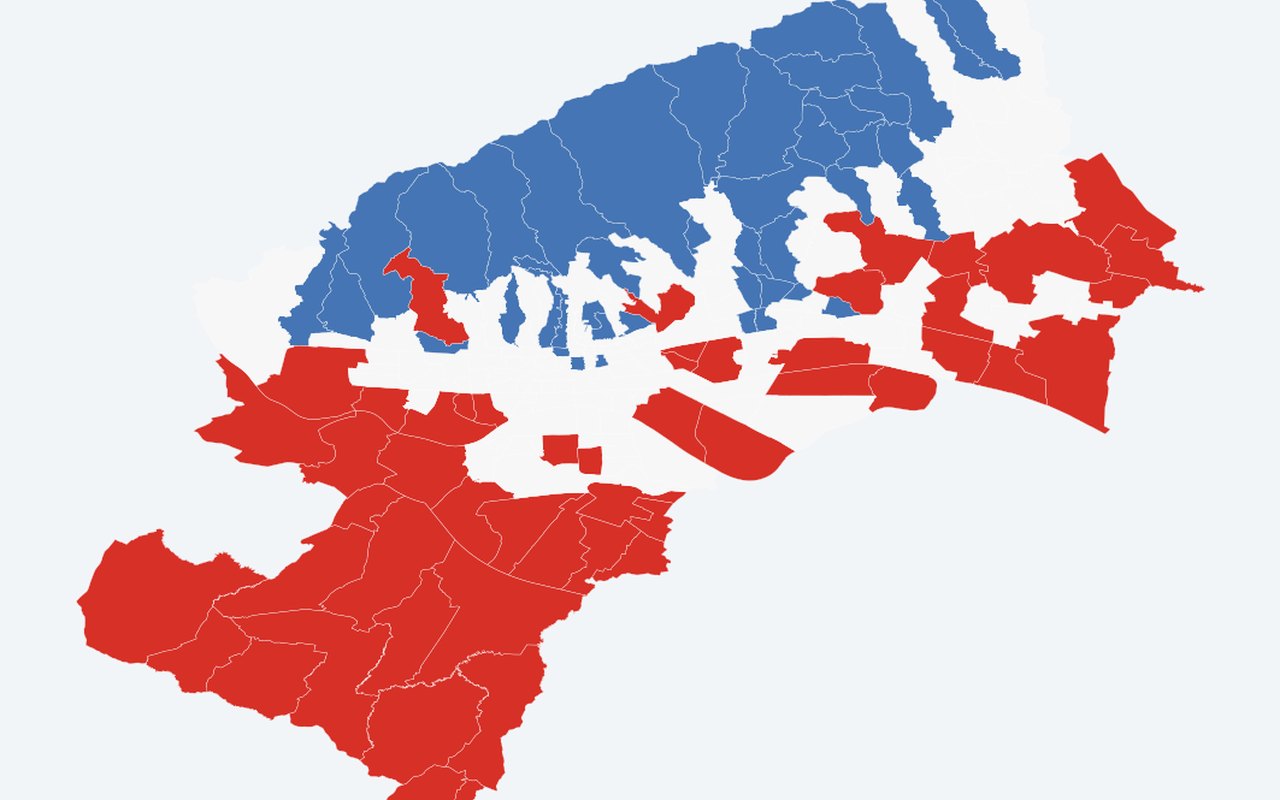
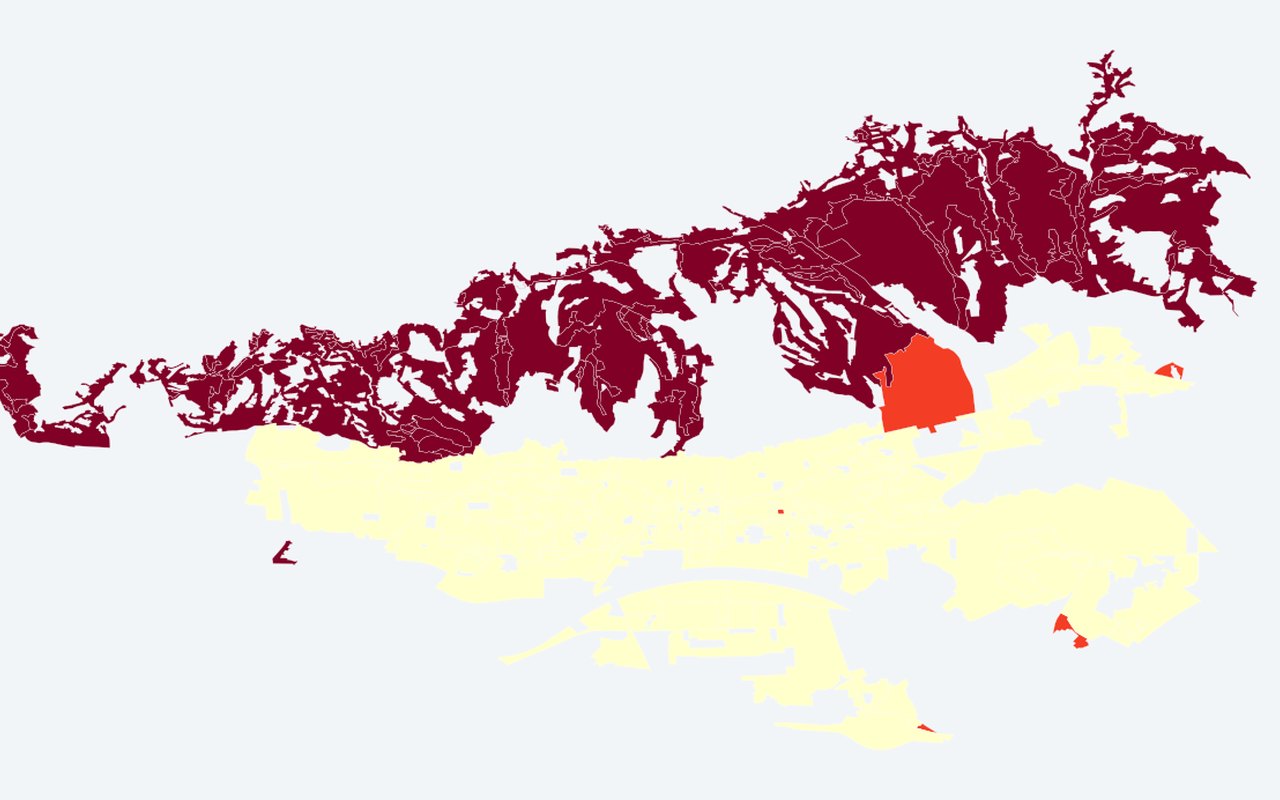
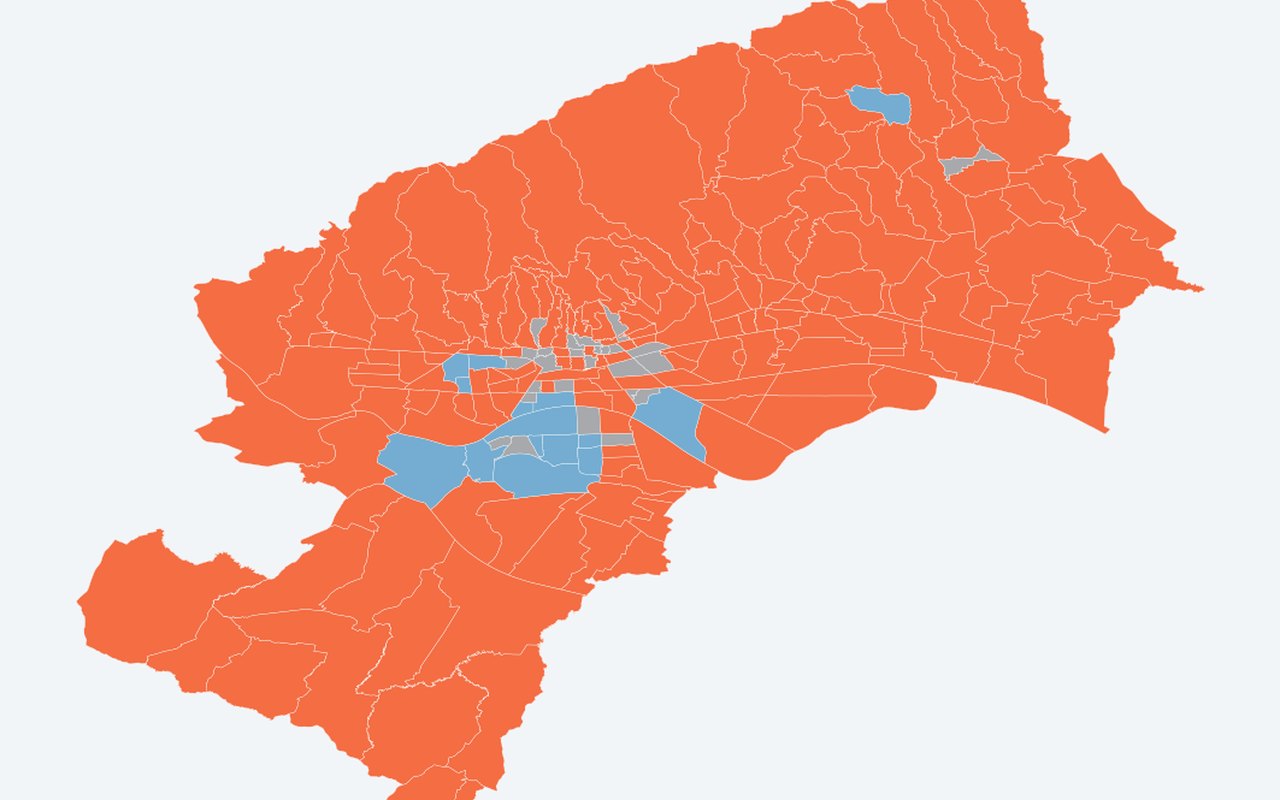
LISA Clusters (HH/LL/HL/LH)
HH = heat cluster, LL = cool cluster, HL/LH = outliers. Grey = not significant at p < 0.05. Within-year Local Moran's I clusters on the composite UHI (recomputed each summer). Year 2024 matches the MDPI paper-date composite.
-
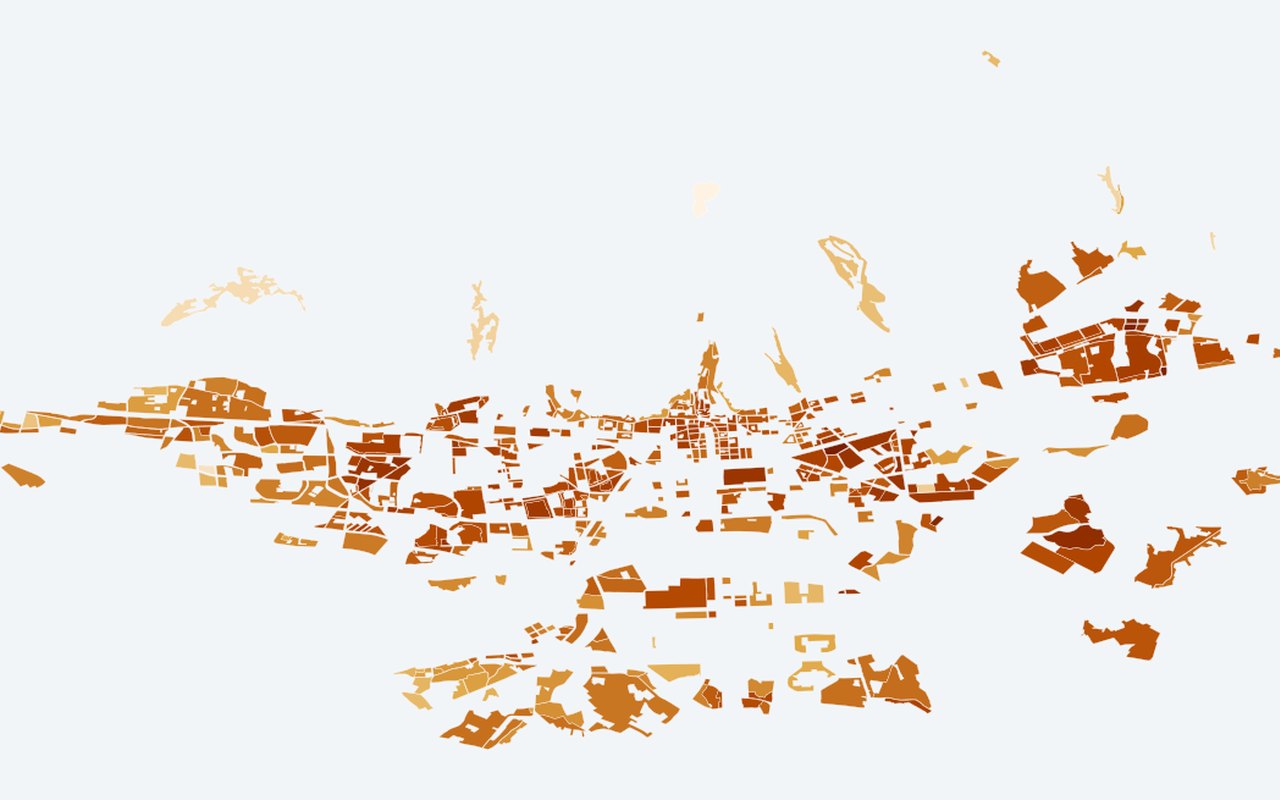
Thermal-Priority Parcels
Residential/mixed-use GUP parcels with enough Landsat pixels where vegetation greenness < threshold AND land surface temperature > threshold (parcel fill + priority pixel count in tooltip).
-
Heat vulnerability index (HVI)
A single neighbourhood score combining heat, elderly share, density, greenness gaps, and heatwave days. Higher values mark places where heat and sensitive populations overlap.
-
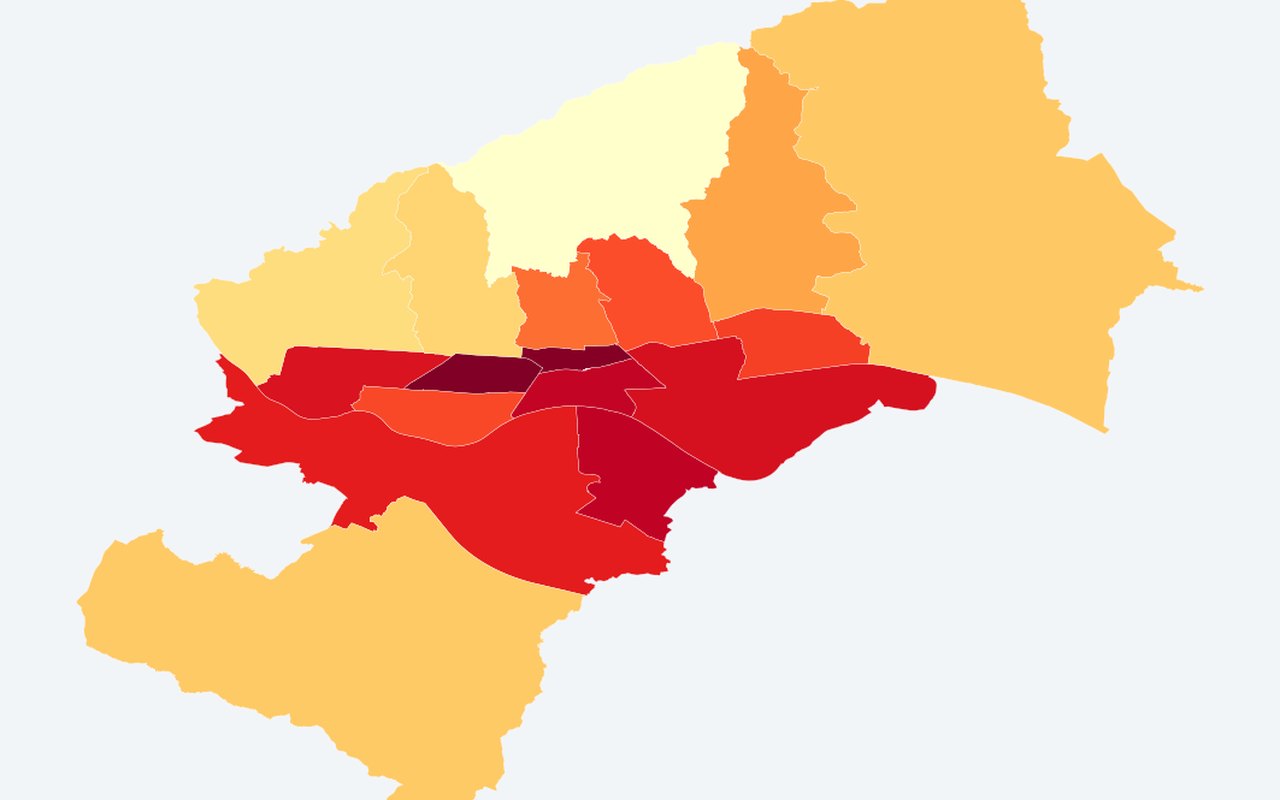
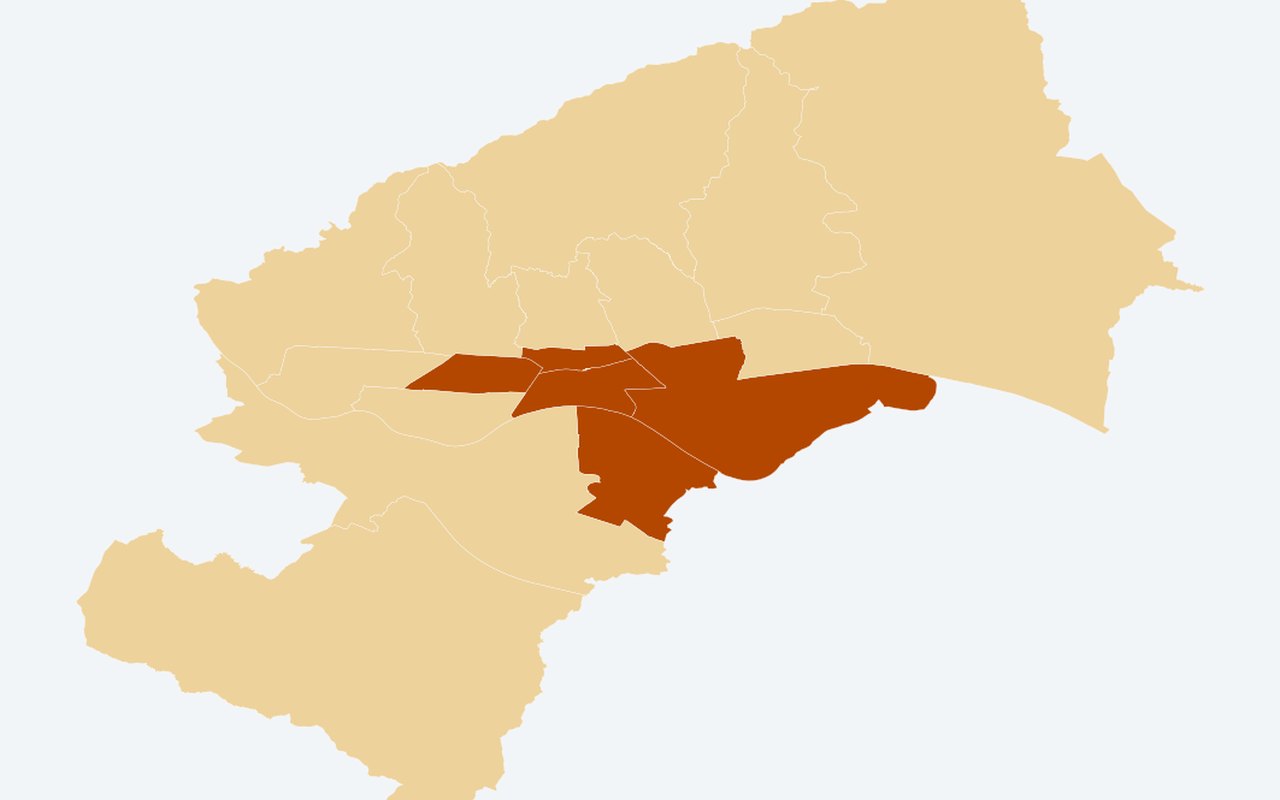
Hot districts
District polygons classified Hot vs Other using mean UHI anomaly ≥ 75th percentile. Districts above the within-year city ΔT hot threshold (set of districts can change by Summer year).

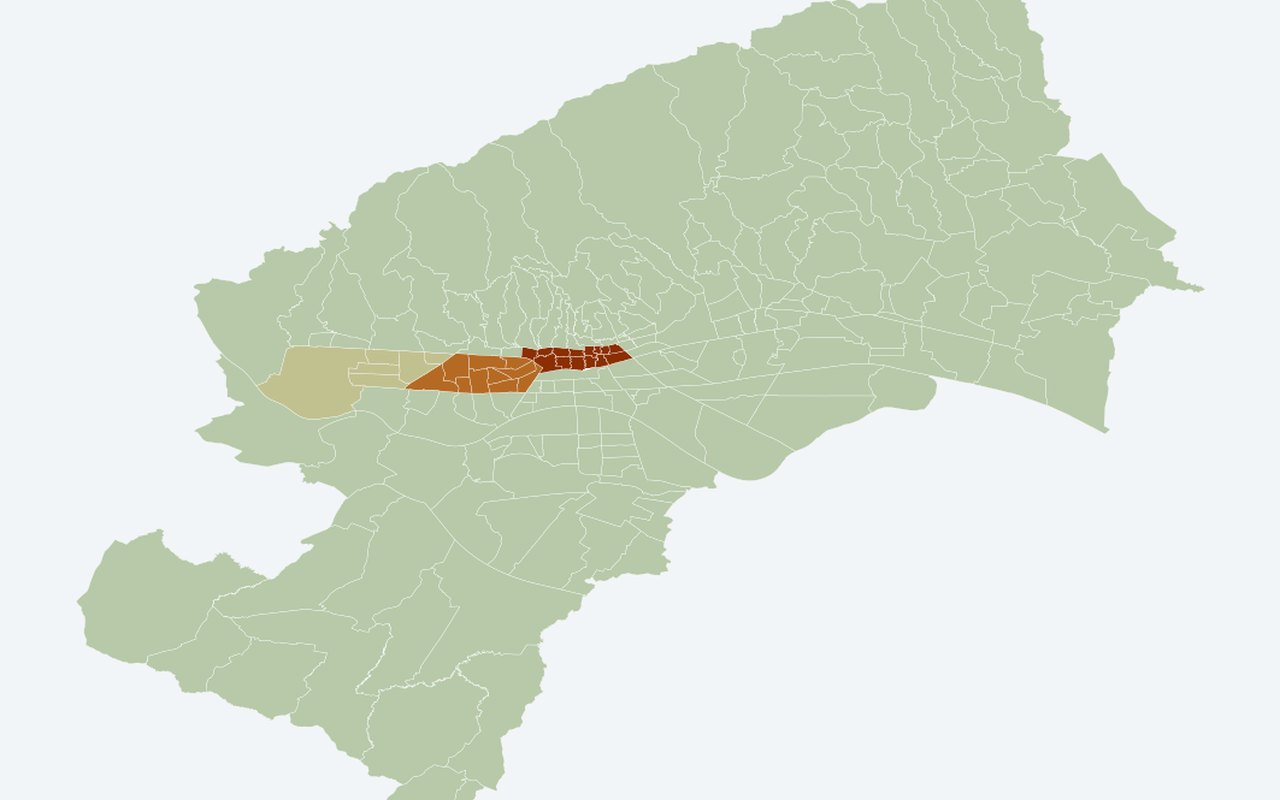
Vulnerability & census
16-
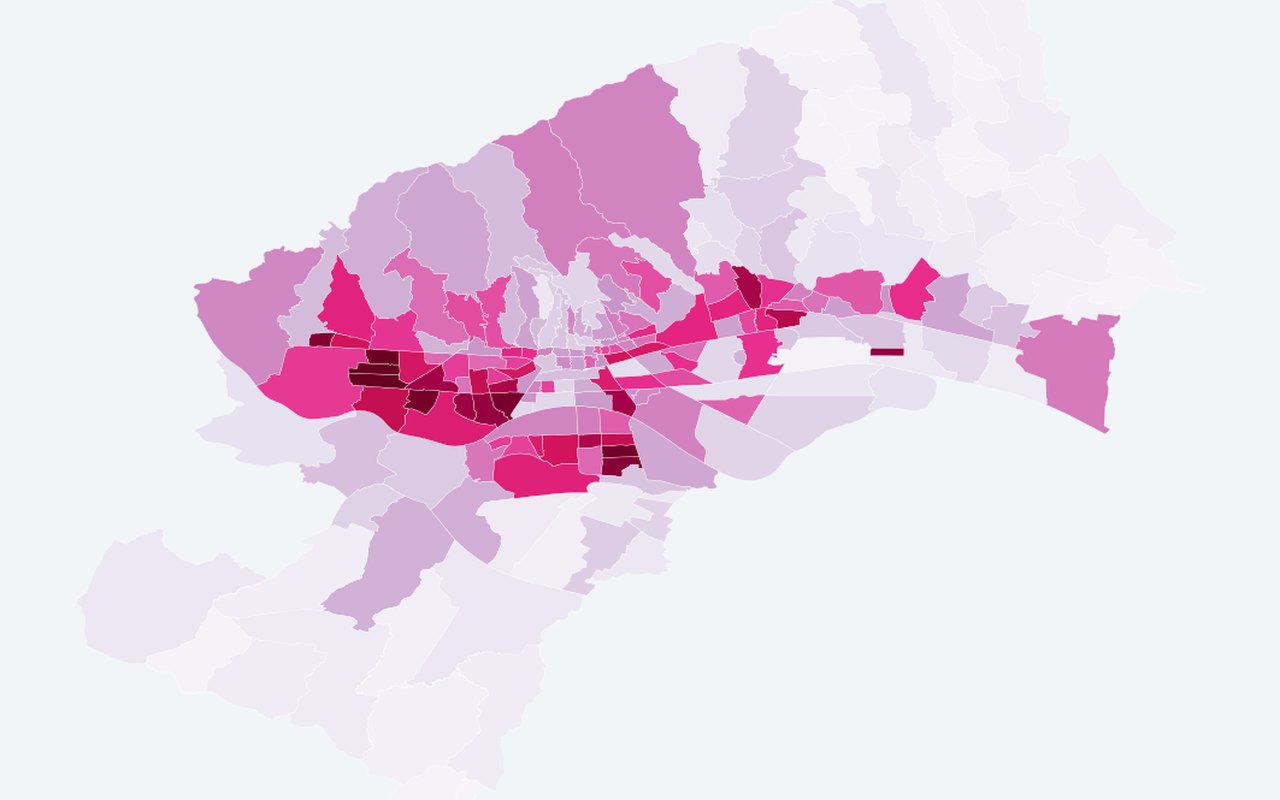
Elderly × warm night LST — MO
0–1 score: elderly_share × ranked night land surface temperature (neighbourhood-level). Within-year score: elderly share × warm night-land surface temperature rank from sparse ECOSTRESS overpasses (not every night). Absolute night °C can rise while this map looks cooler — compare with Night land surface temperature — neighbourhood and air temperature.
-
Elderly heat exposure score — MO
0–1 score: elderly_share × robust_norm(estimated_air_temp_2m_C). Spatial detail comes from **census**, not ERA5-Land air.
-
Population density — MO polygons (light fill)
Light blue choropleth on population_density; colour bar spans **neighbourhood 2nd–98th** density percentiles (values outside saturate). Not the combined 0.6×pop + 0.4×density planning index. **Off by default** on the integrated map.
-
Elderly share 65+ — MO polygons (2021)
Fill colour from elderly_share (0–1). Tooltip/popup include formatted percentage columns. **Off by default** (toggle with population density for comparison).
-
Children share 0–14 — MO polygons (2021)
Fill colour from children_share (0–1); legend uses a robust neighbourhood-only band (2–98%iles, fallback 0–1) so clustered shares use the colour scale. Tooltip/popup include formatted percentage columns. **Off by default.**.
-
Working-age share 15–64 — MO polygons (2021)
Fill colour from working_share (0–1); legend uses a robust neighbourhood-only band (2–98%iles, fallback 0–1) for clustered shares. Tooltip/popup include formatted percentage columns. **Off by default.**.
-
Census 2021: MO polygons (combined index, click for popup)
neighbourhood fill coloured by combined index; click for counts, density, age shares (% of total). Separate pane from density and share fills; still below land surface temperature map tiles on the integrated map.
-
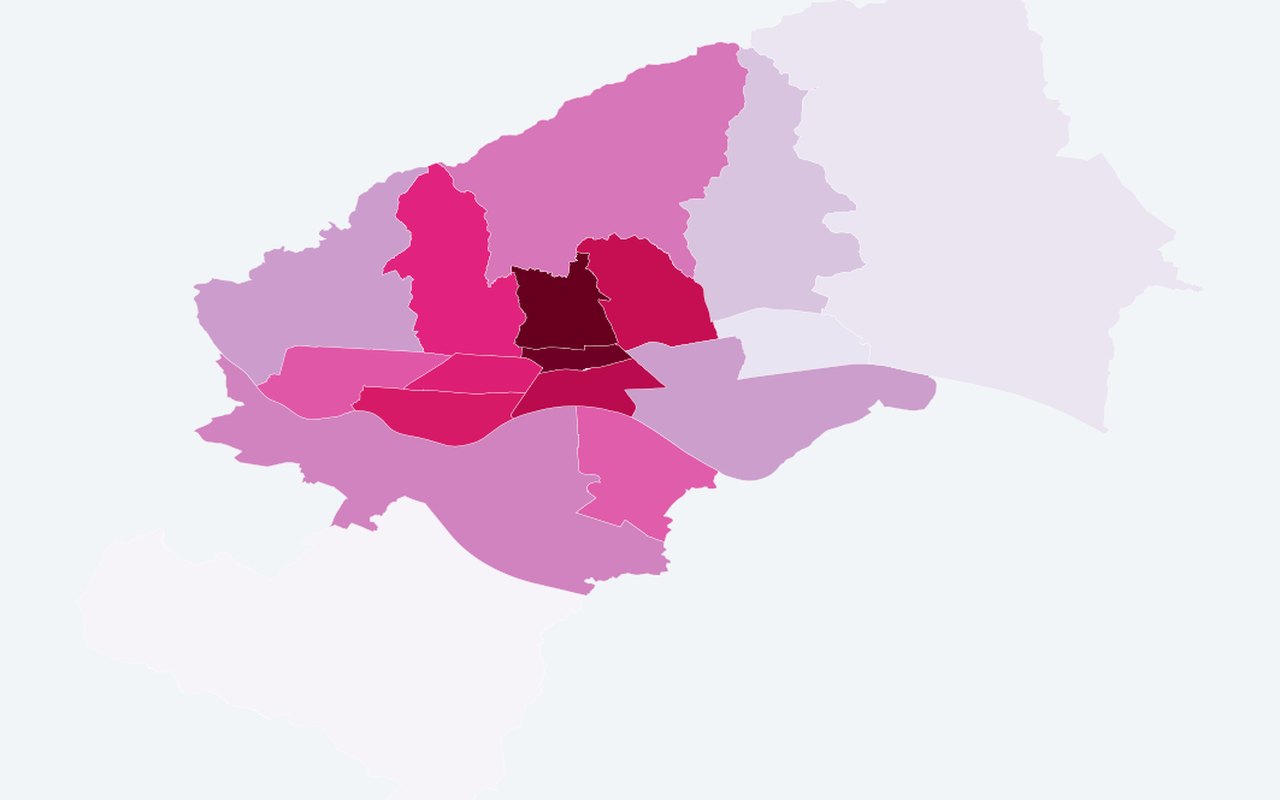
Education 2021: education table (by district)
Green choropleth by higher-education share; hover or click a district for all Tabela 2 counts and shares. Share with higher education by city district.
-
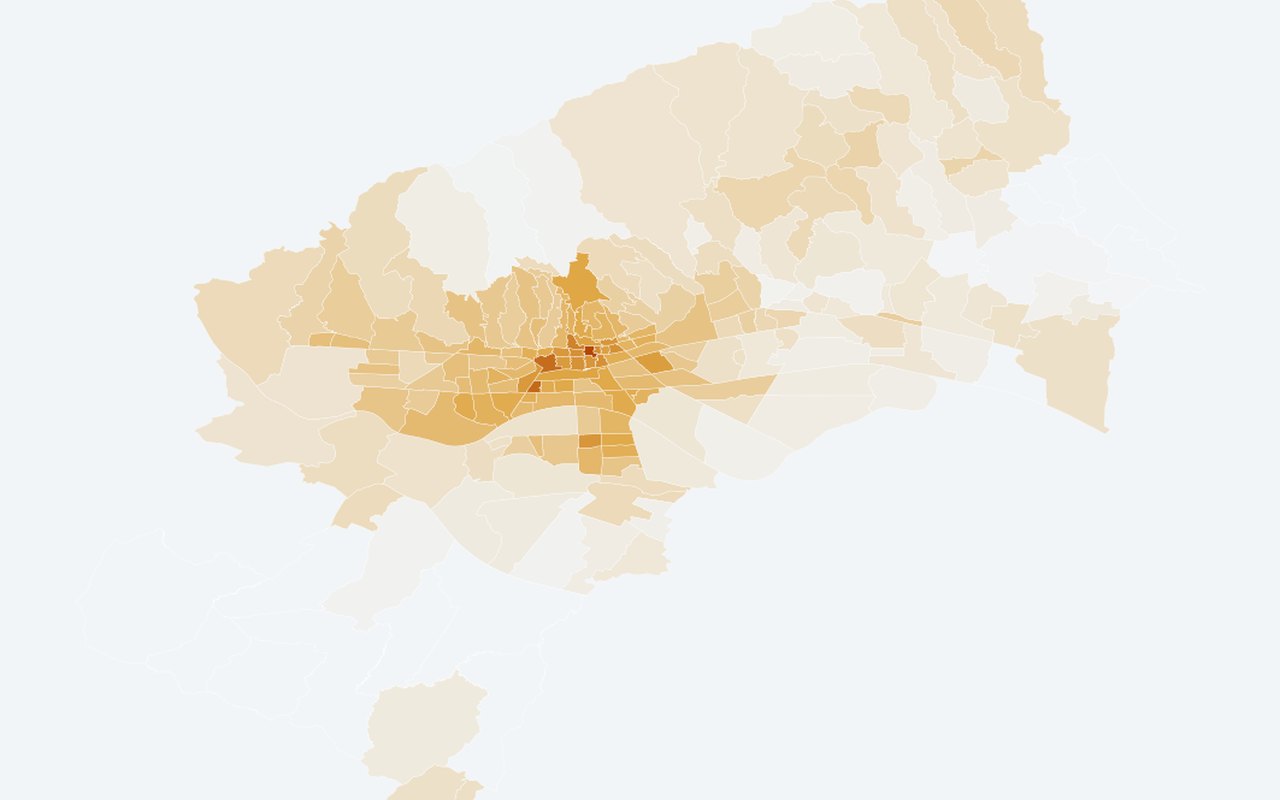
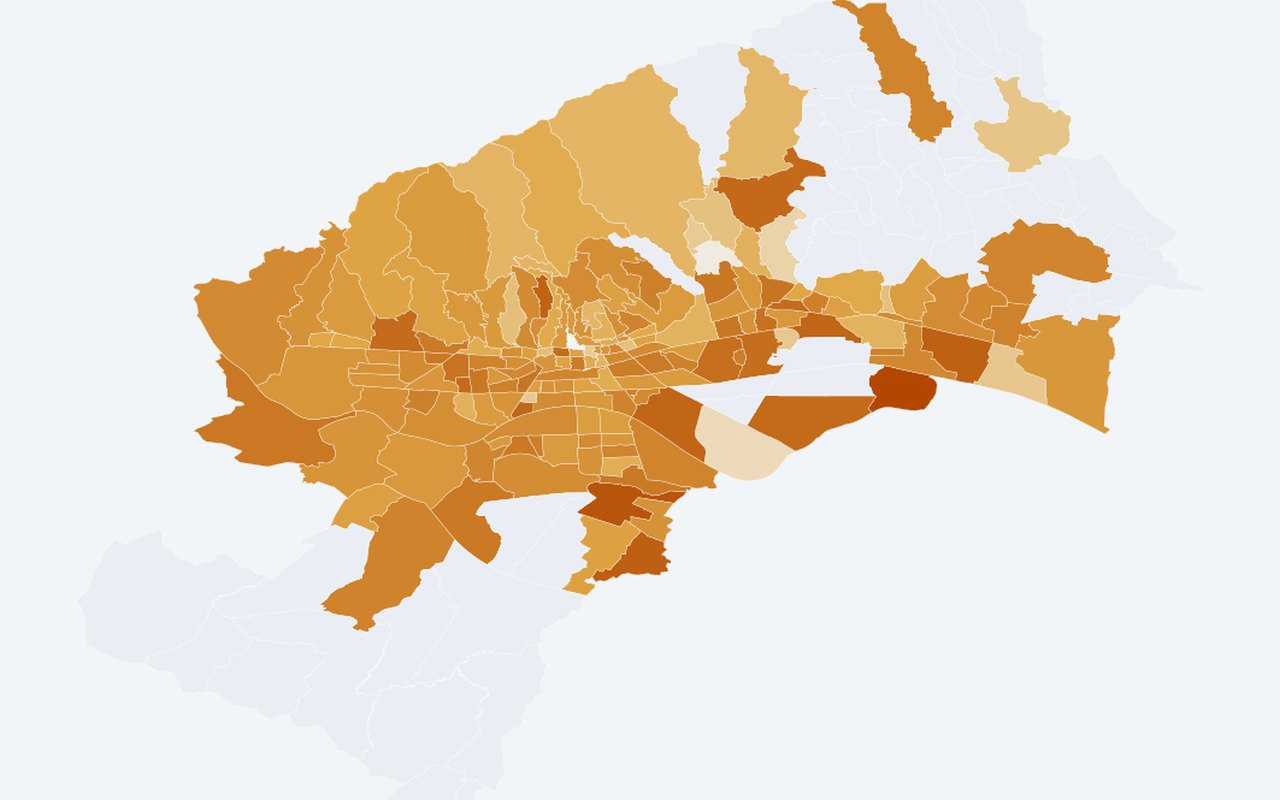
Education 2021: least educated districts (low formal schooling)
Darker orange = higher share_low_formal_education (no school + primary grades 1–7 + completed primary only). Share with primary schooling only (proxy for lower formal education).
-
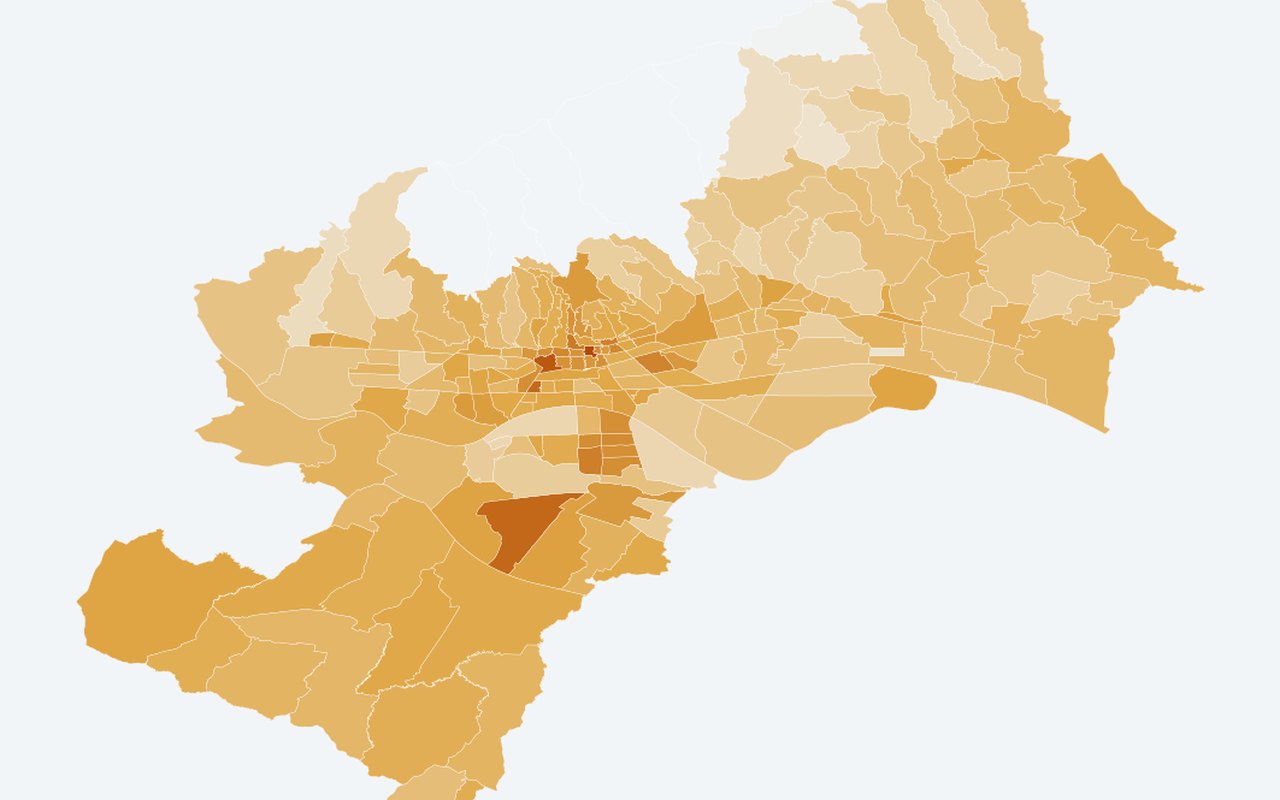
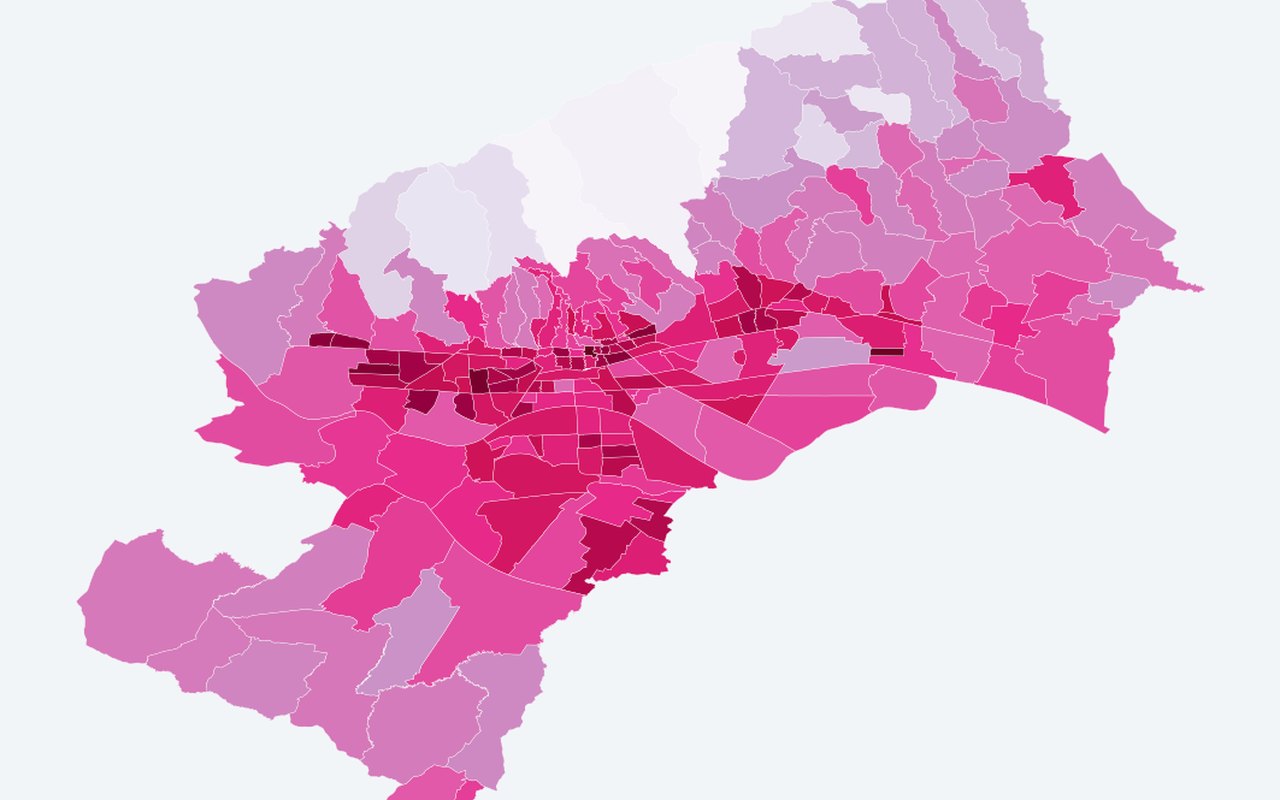
Citizen survey heat burden
Survey-derived heat-burden and vulnerability indicators on neighbourhood or district polygons. Self-reported heat burden index (neighbourhood).
-
Heat Risk Population Index (HRPI) — 2024 (Earth 2026)
A neighbourhood heat-risk score that blends summer air and surface temperature with demographic sensitivity and population density. Higher values mean more combined heat and people at risk.
-
GWR local β (demographic sensitivity) — Earth 2026
Local β_DSI from adaptive bisquare local regression (heat risk index ~ demographic sensitivity + land surface temperature + air temperature). Higher = stronger local demographic effect.
-
GWR local R² — Earth 2026
Local R² from local regression windows (0–1). Peripheral neighbourhoods often show higher fit than complex central zones.
-
Heat-risk dominant driver (climate vs demography)
Climate-driven vs demography-driven classification from |β×component| magnitudes (climate uses land surface temperature + air temperature).
-
Thermal-risk intervention priority (Earth 2026)
Critical hotspot (high heat risk index + high β_DSI), climate hotspot, demographic-sensitive, or stable. Planning screen combining high heat risk index with demographic sensitivity.
-
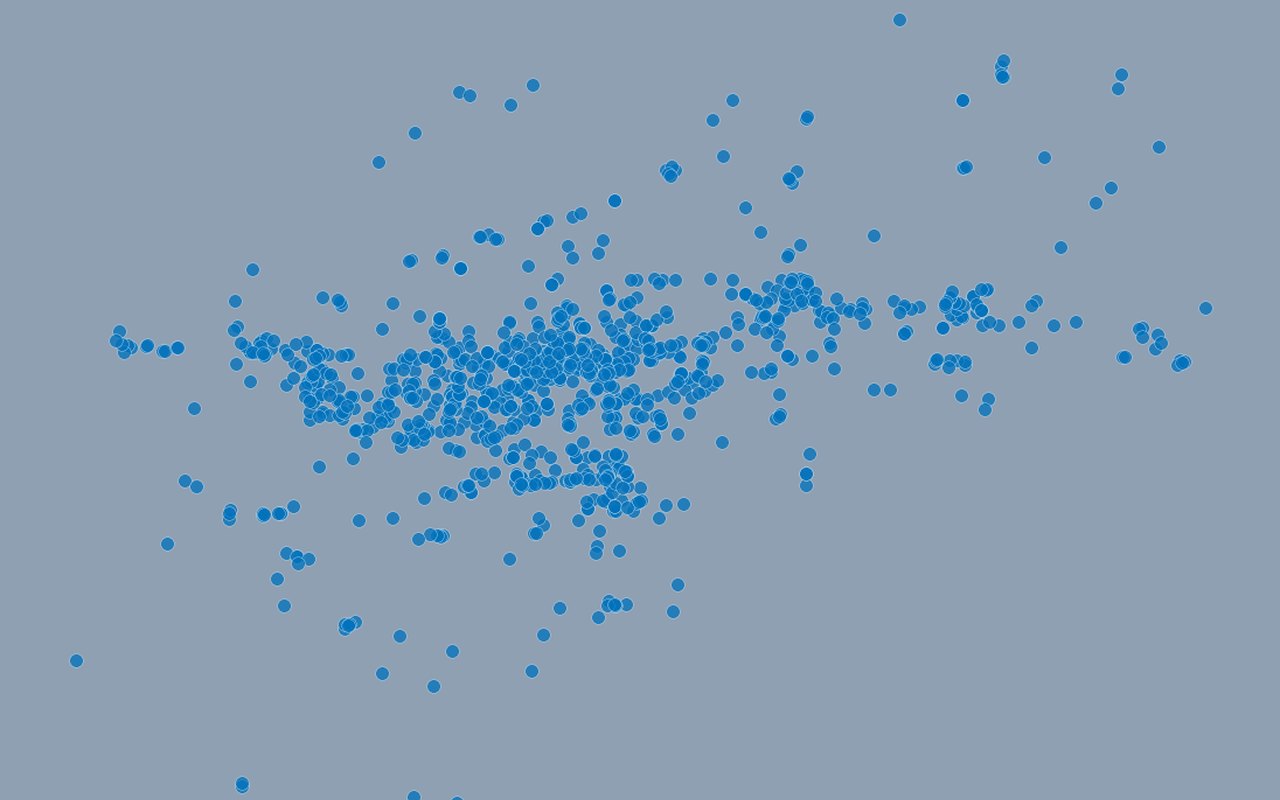
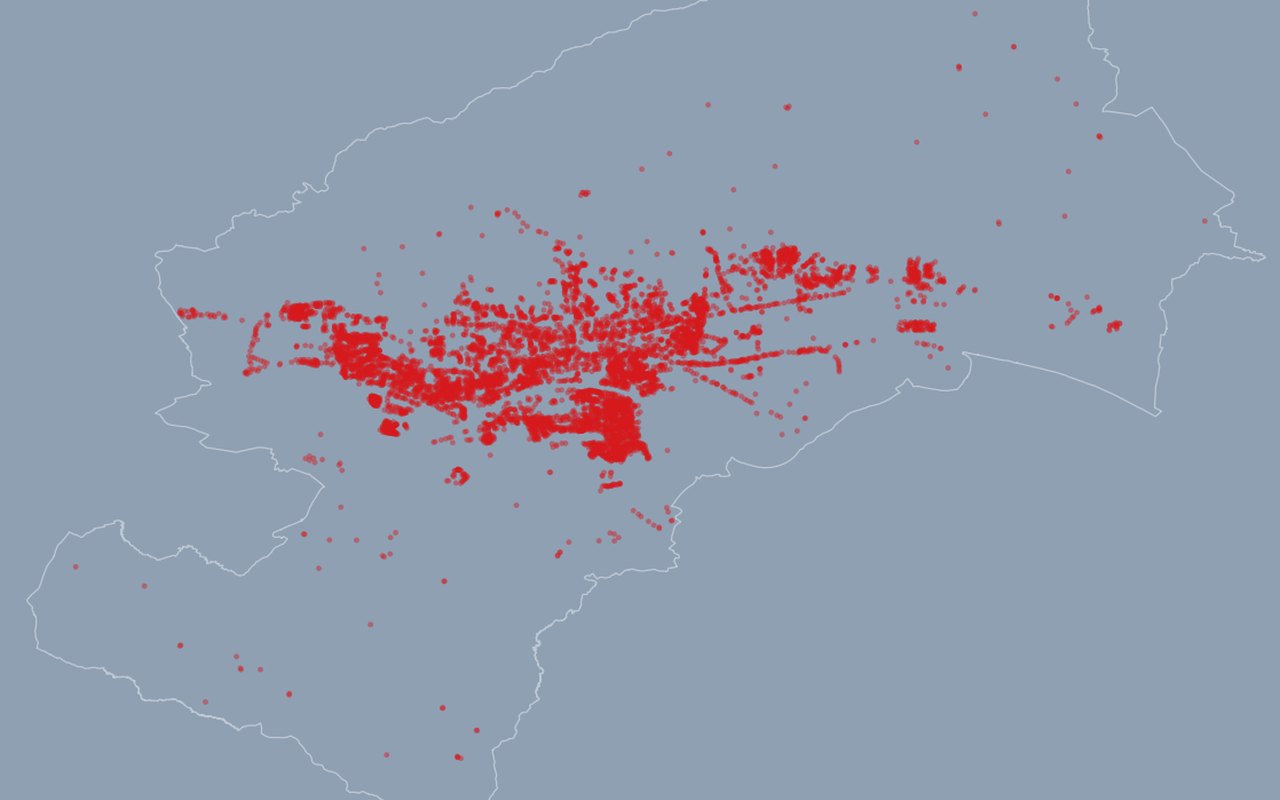
Sensitive facilities
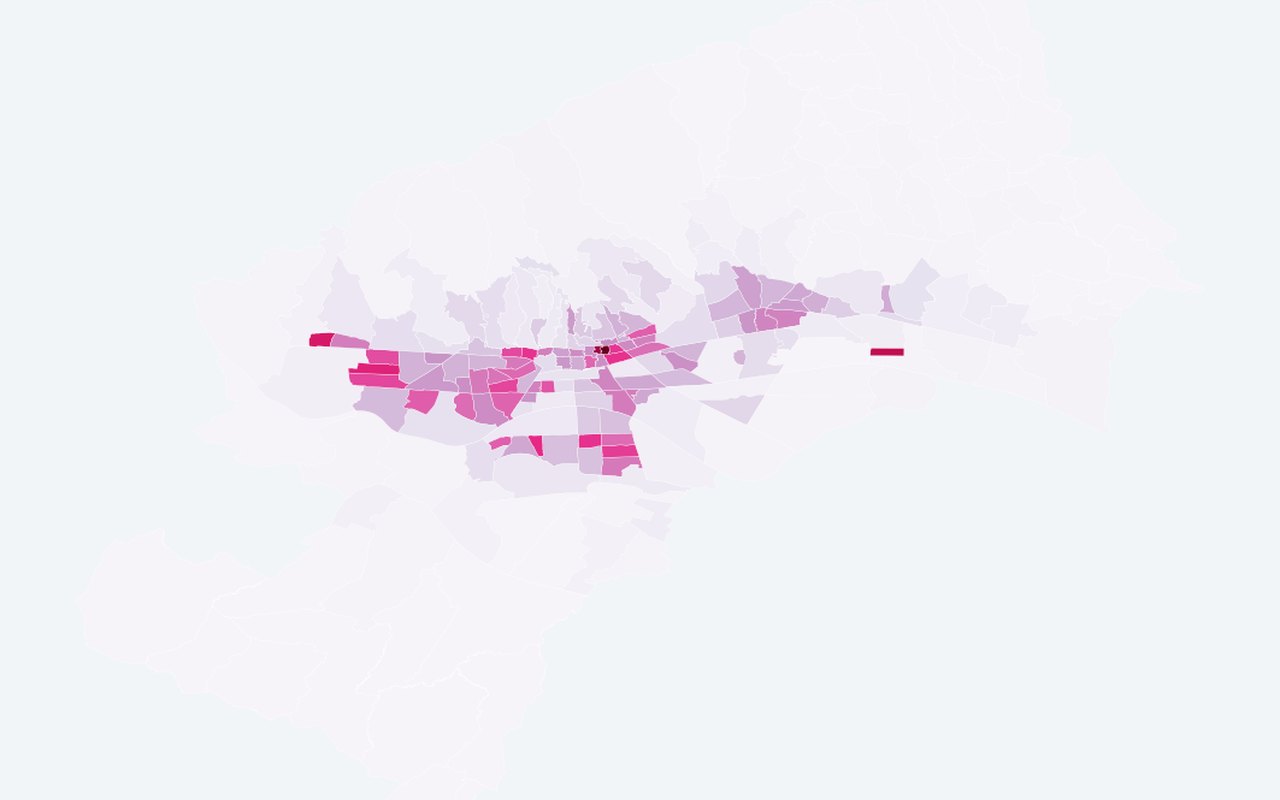
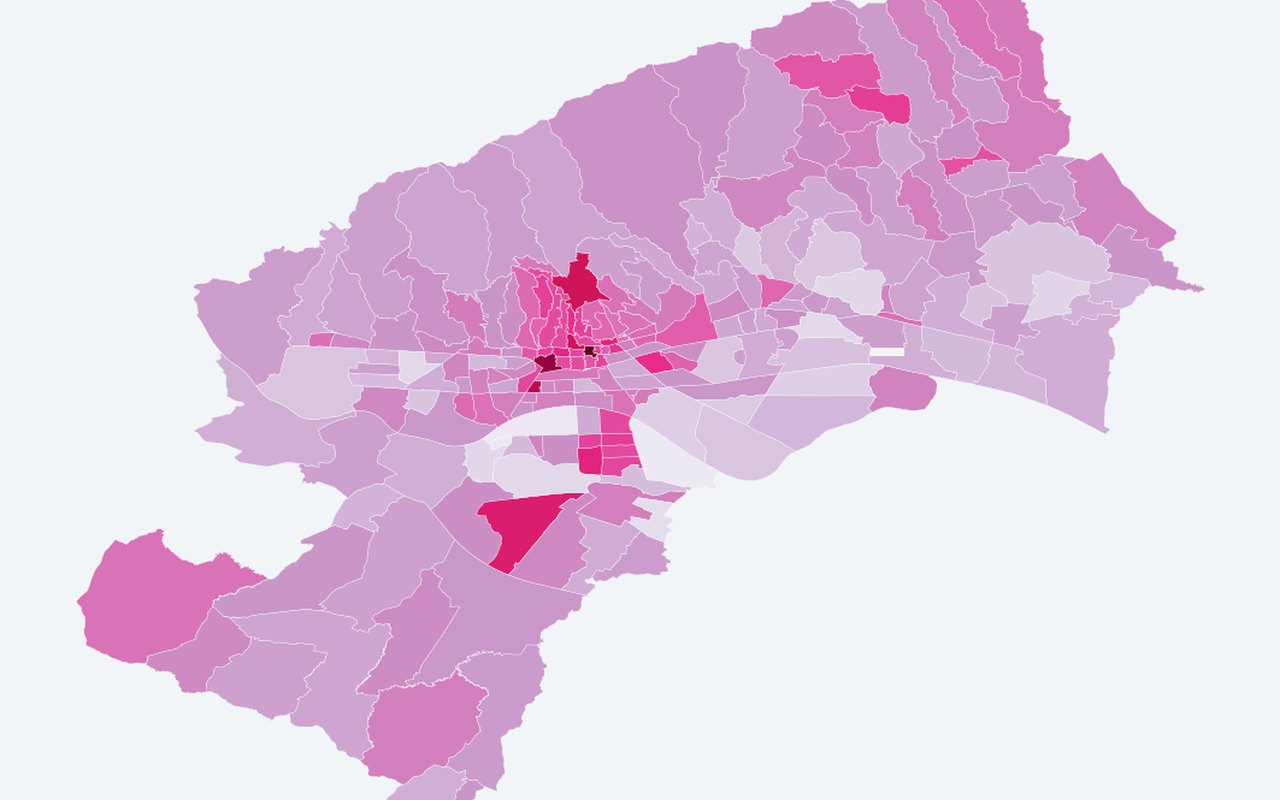
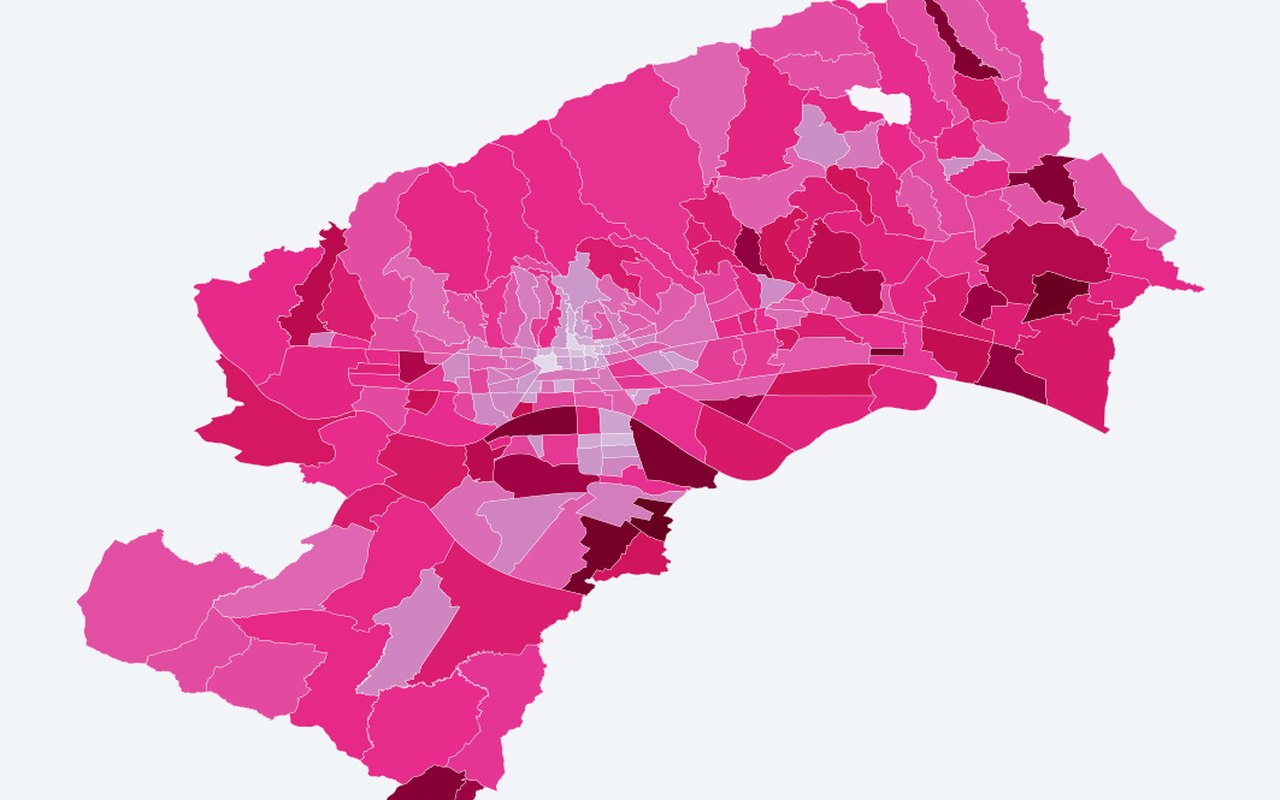
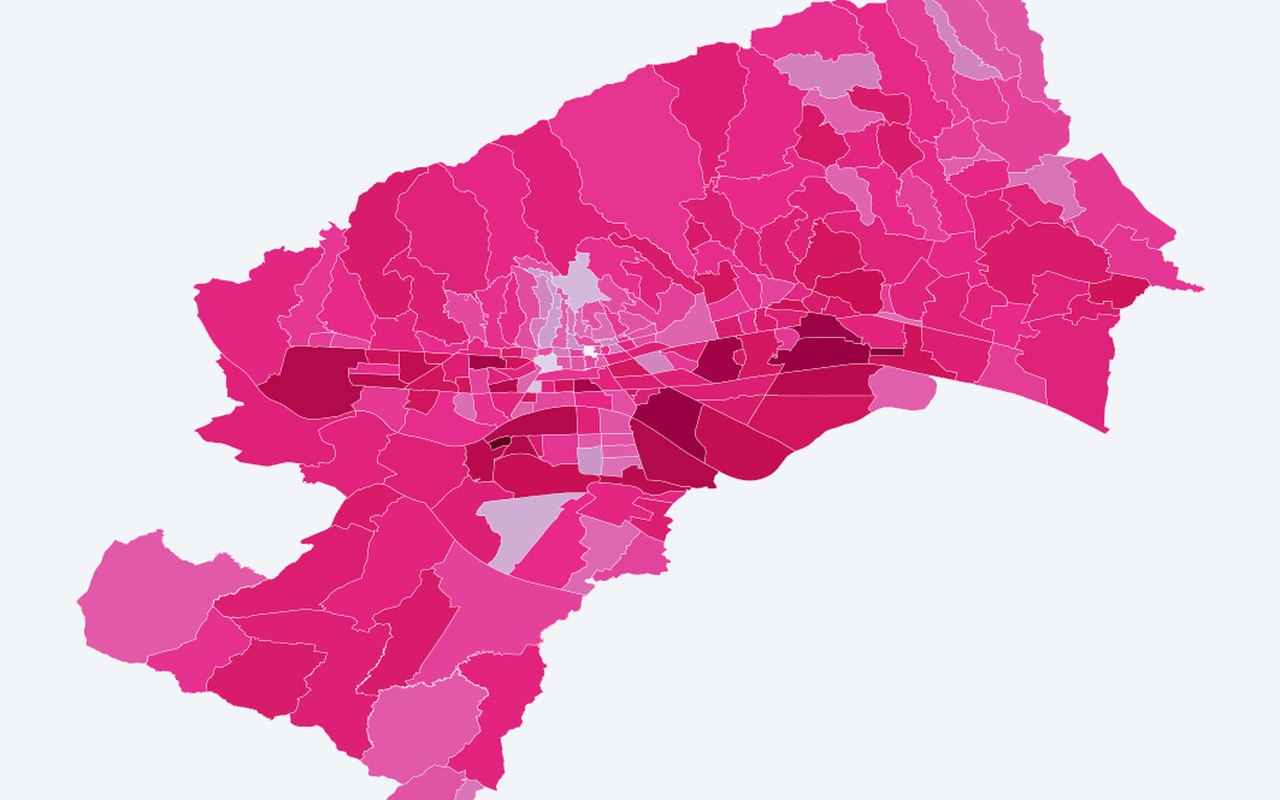
Point locations of sensitive facilities, often filtered or highlighted in the 32 hot+dense neighbourhoods. Schools, kindergartens, healthcare and sport sites.




City amenities
15-
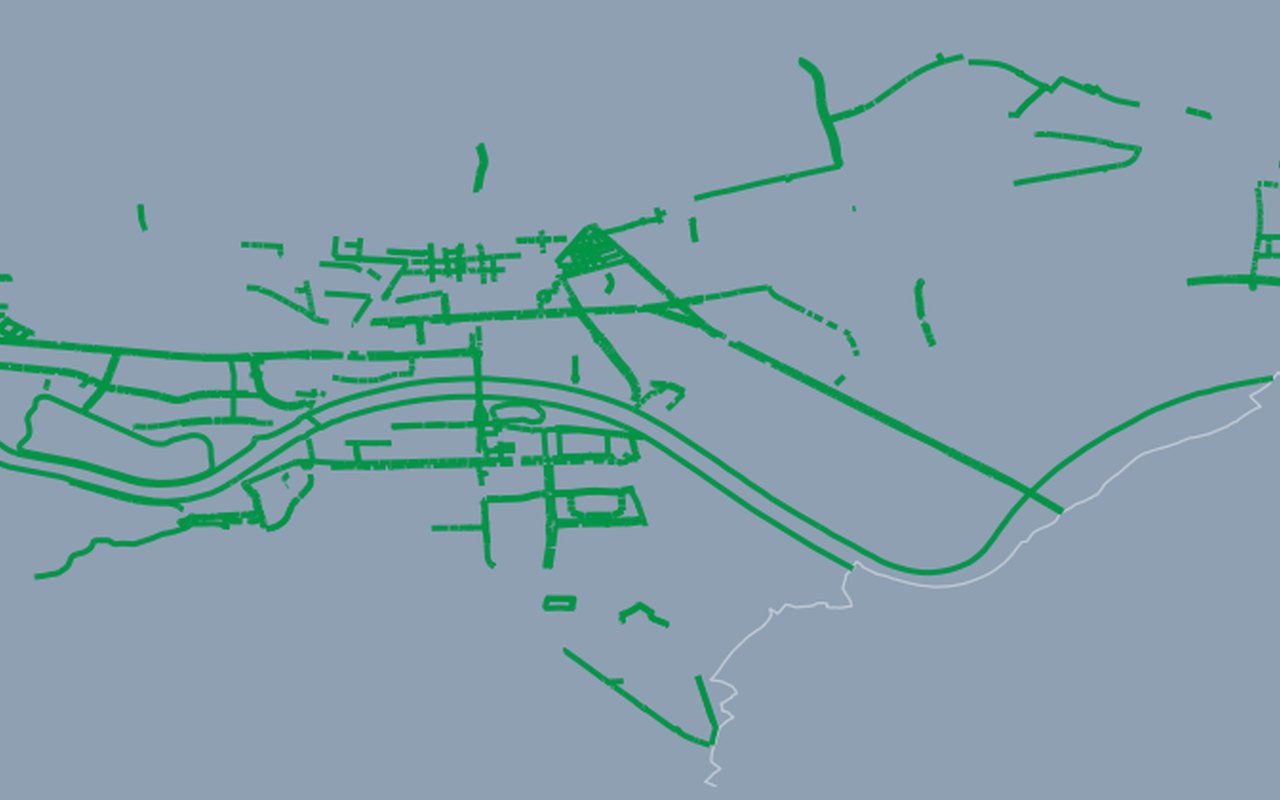
Bicycle Paths
Mapped bicycle/pedestrian route segments from the official city mobility dataset. Official bicycle path network.
-
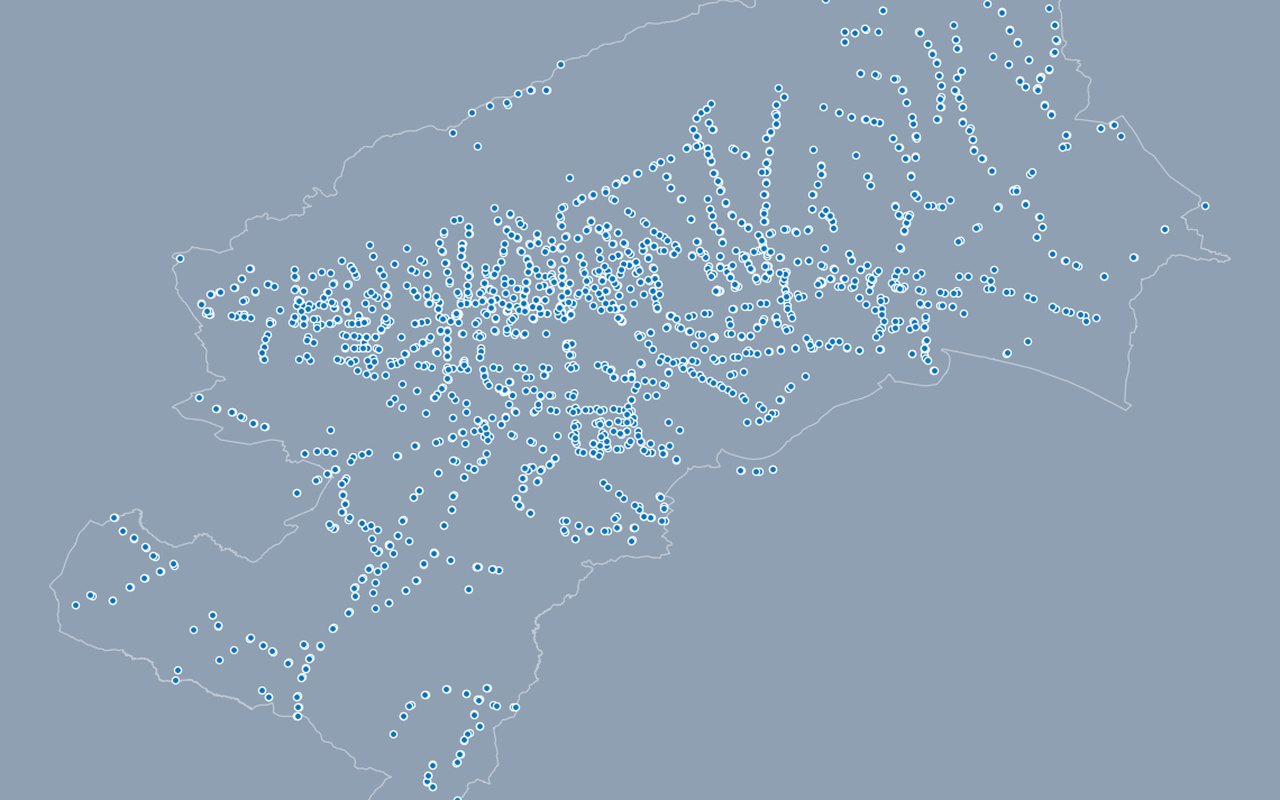
Bus Stations / Stops
Bus stop locations with line and accessibility attributes. Public bus stops.
-
Tram Stations
Tram stop locations with line and accessibility attributes. Tram stops.
-
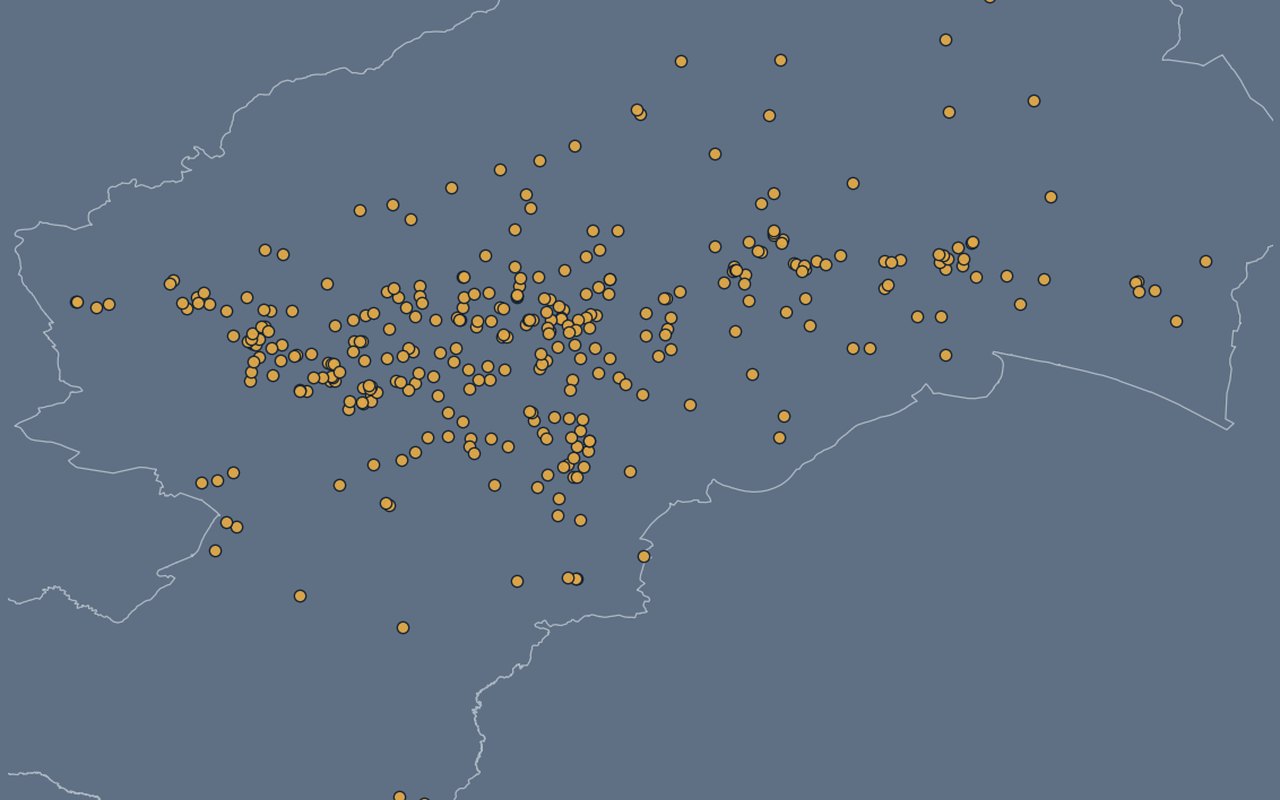
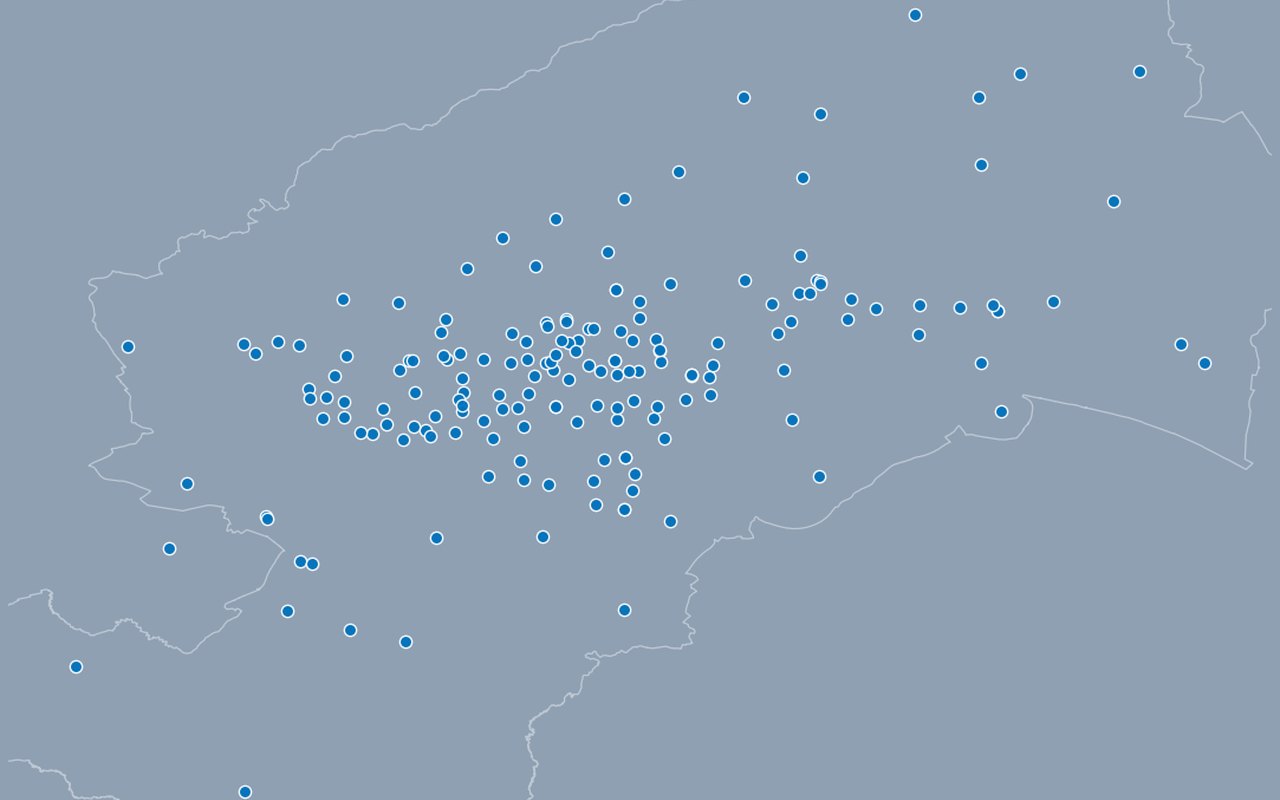
Kindergartens
Registered kindergarten (dječji vrtić) locations across Zagreb. Kindergarten locations.
-
Elementary Schools
Public elementary (osnovna škola) locations across Zagreb. Elementary school locations.
-
High Schools
All public high-school locations in Zagreb (gymnasium, vocational, arts, private, special-needs) as points. High school locations.
-
Healthcare Providers
Point locations of registered providers with contact/address attributes where available. Healthcare provider locations.
-
City Outdoor Markets
Point locations of city markets with contact/opening attributes when provided. Outdoor market locations.
-
Public Spaces for Dogs
Designated public dog-space locations. Dog parks / public dog spaces.
-
Sport Fields
Public sport-field point locations. Sport field locations.
-
Sport Facilities
Sports-facility point locations with category/operator attributes. Sport facility locations.
-
Student Accommodation
Student accommodation point locations. Student housing locations.
-
Water Drinking Fountains
Public drinking-fountain point locations. Public drinking fountains.
-
Public Bike Parking
Public bike-parking stand locations with capacity attributes where available. Public bicycle parking stands.
-
Tourism Accommodation
Tourism accommodation point locations and type metadata. Tourism accommodation locations.





Greenery
6-
Tree cover deficit
Shows where neighbourhoods lack vegetation greenness relative to a realistic greening target (Stenjevec-style NDVI 0.422), mapped for all 218 mjesni odbori.
-
NDVI greening trend
District polygons coloured by Sentinel-2 vegetation greenness slope (per year). Positive = greening. Sentinel-2 vegetation greenness slope per year by district.
-
Cool refuge access
neighbourhood centroids or points coloured by walk minutes to the nearest mapped green / cool space. Walk time to nearest cool refuge (RQ-D).
-
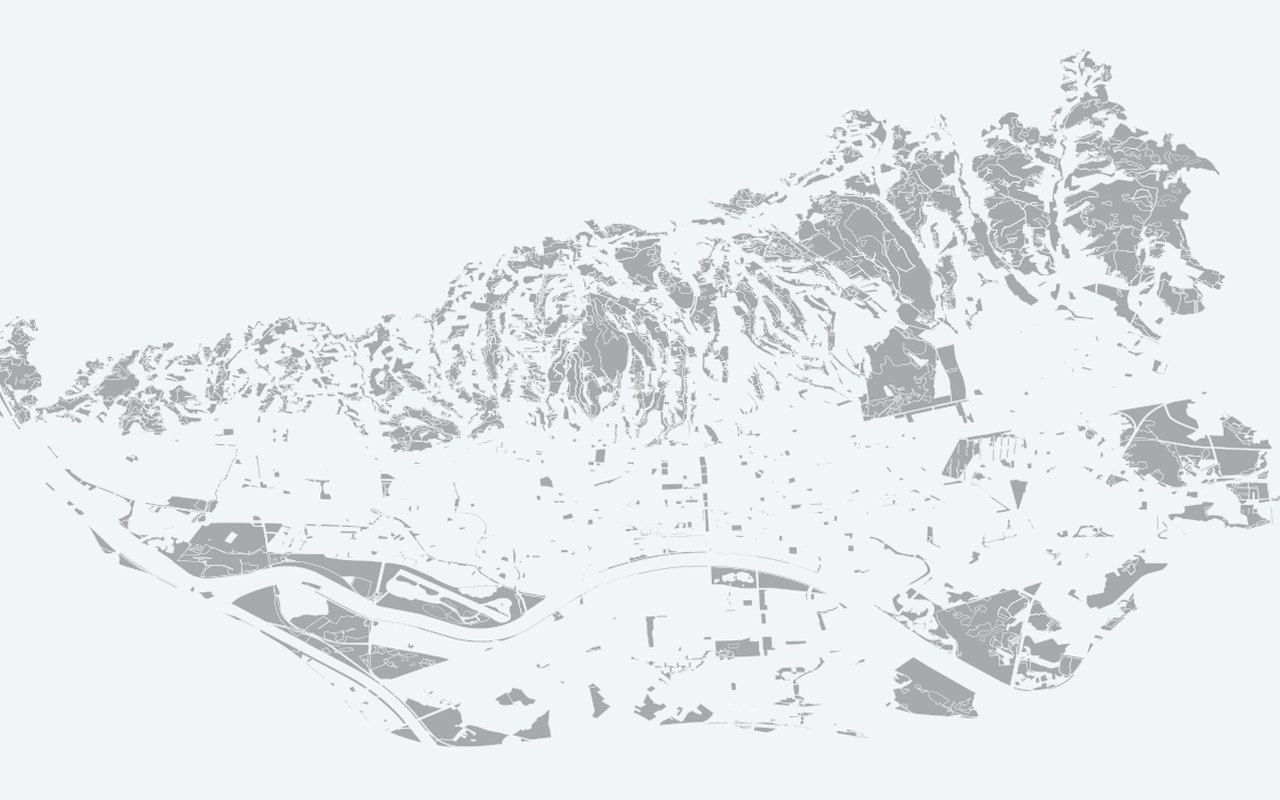
Green Areas (GUP zeleno + šuma)
Polygons from the city's Generalni urbanistički plan (GUP). Official green / forest polygons from GUP.
-
Green Cadastre (Trees)
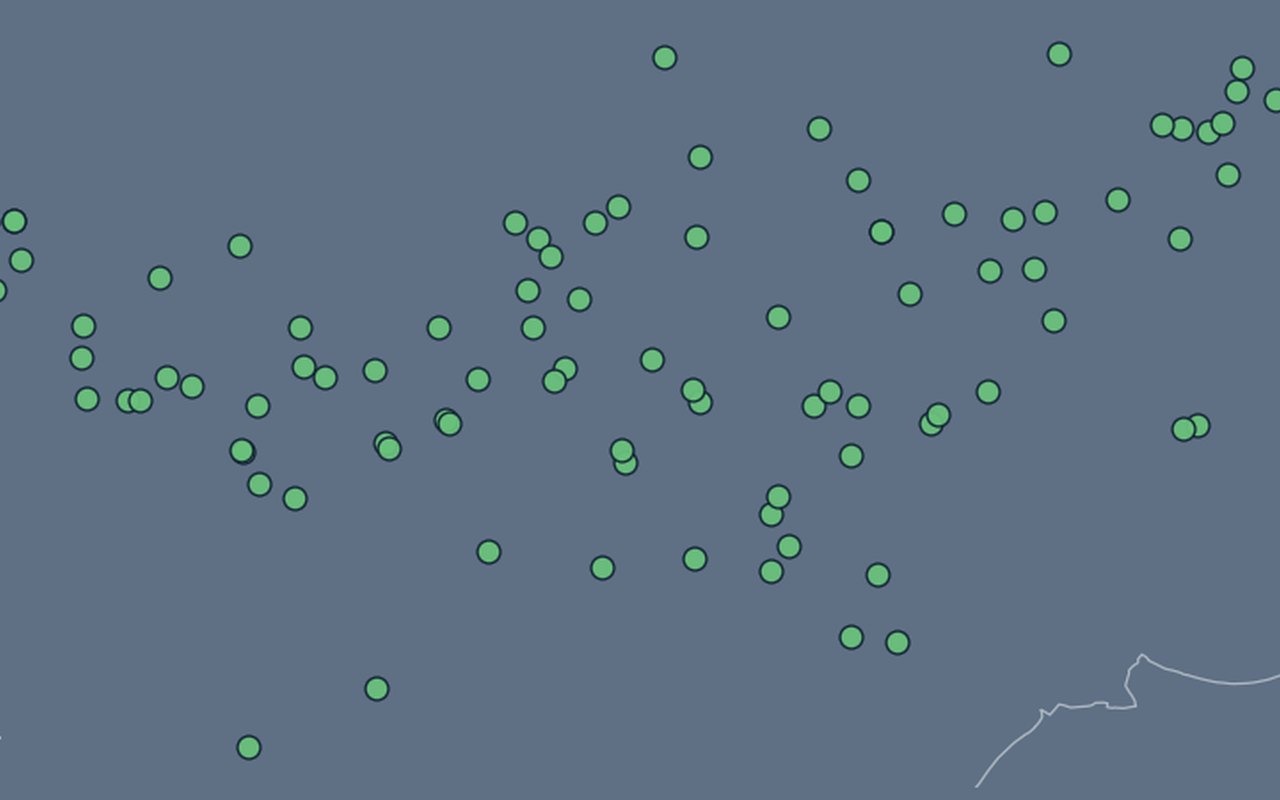
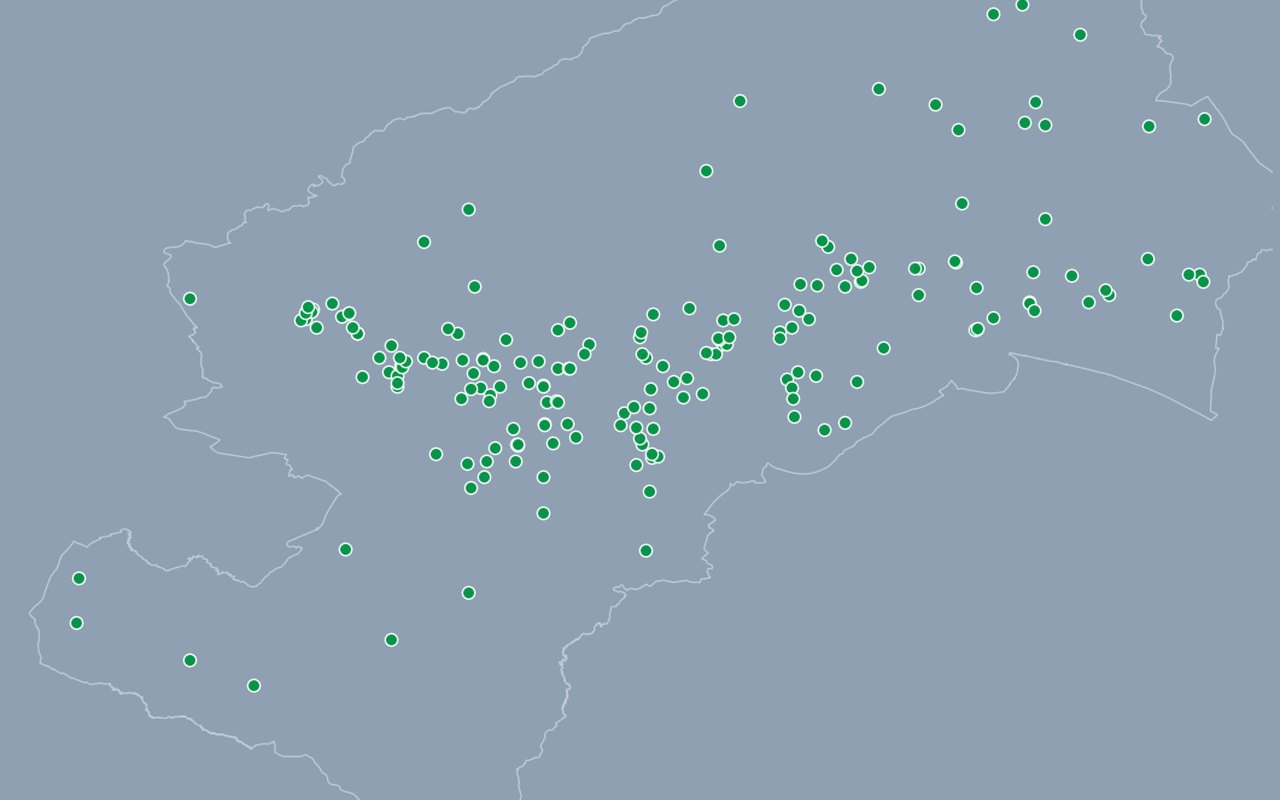
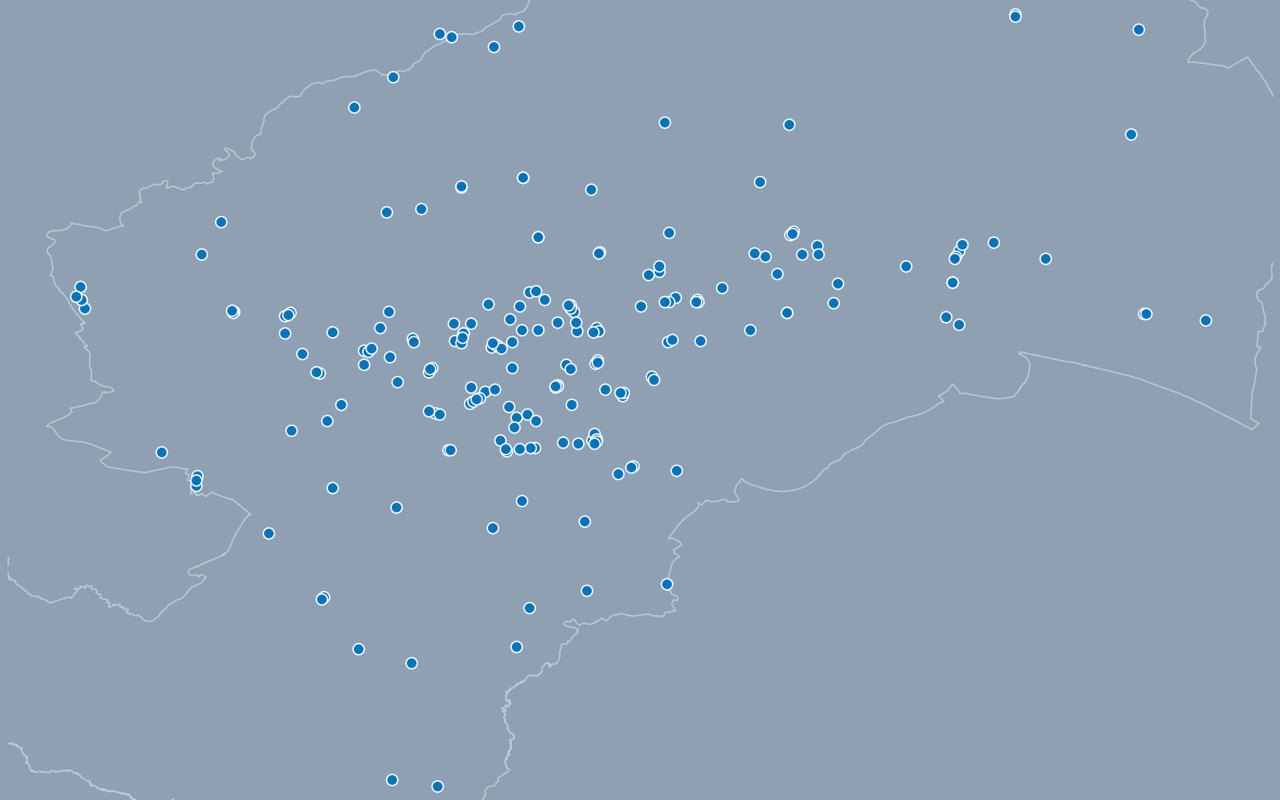
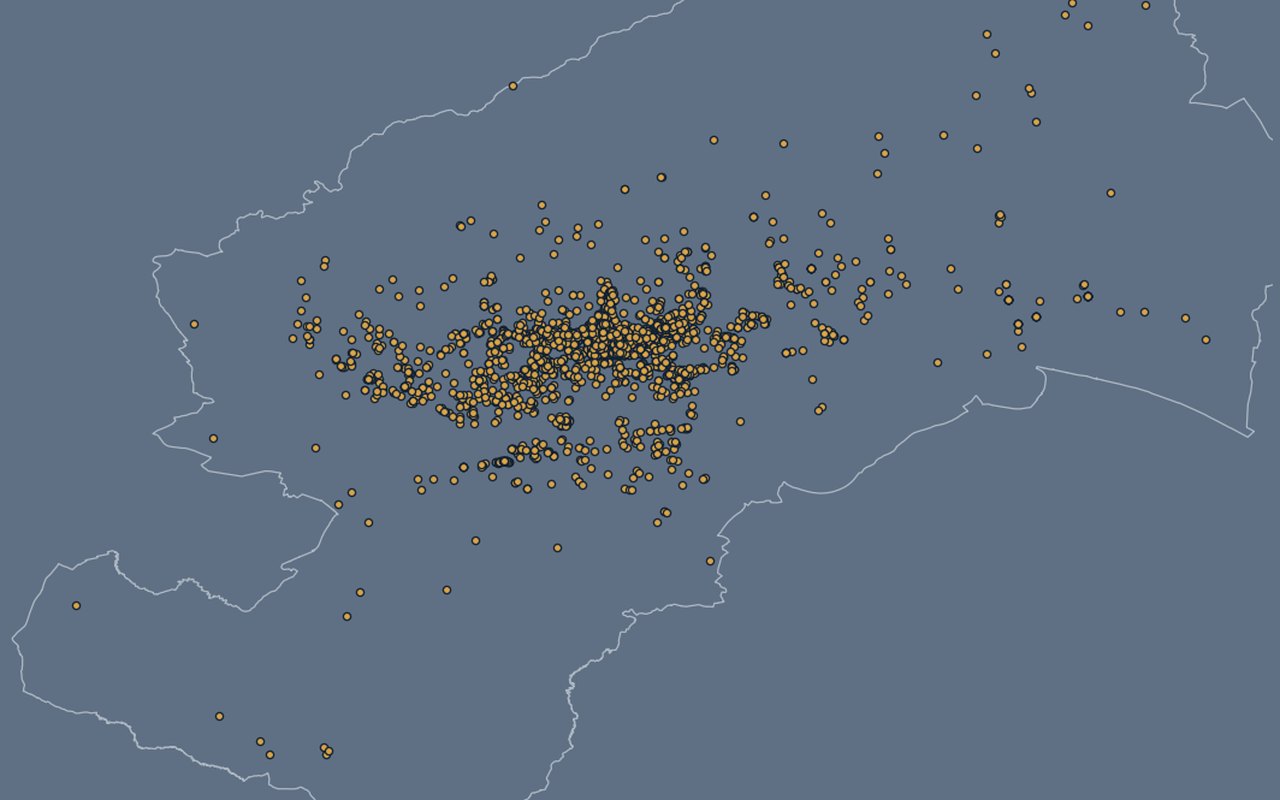
Individual trees from Zagreb’s official green cadastre. Zoom in to explore species and size cues such as height and crown.
-
Green Cadastre (Tree Density)
Heatmap of tree point density (same inventory as the clustered tree layer). Heatmap of tree density from the green cadastre (blurred intensity, not individual trees).


Reference
2-
City of Zagreb Boundary
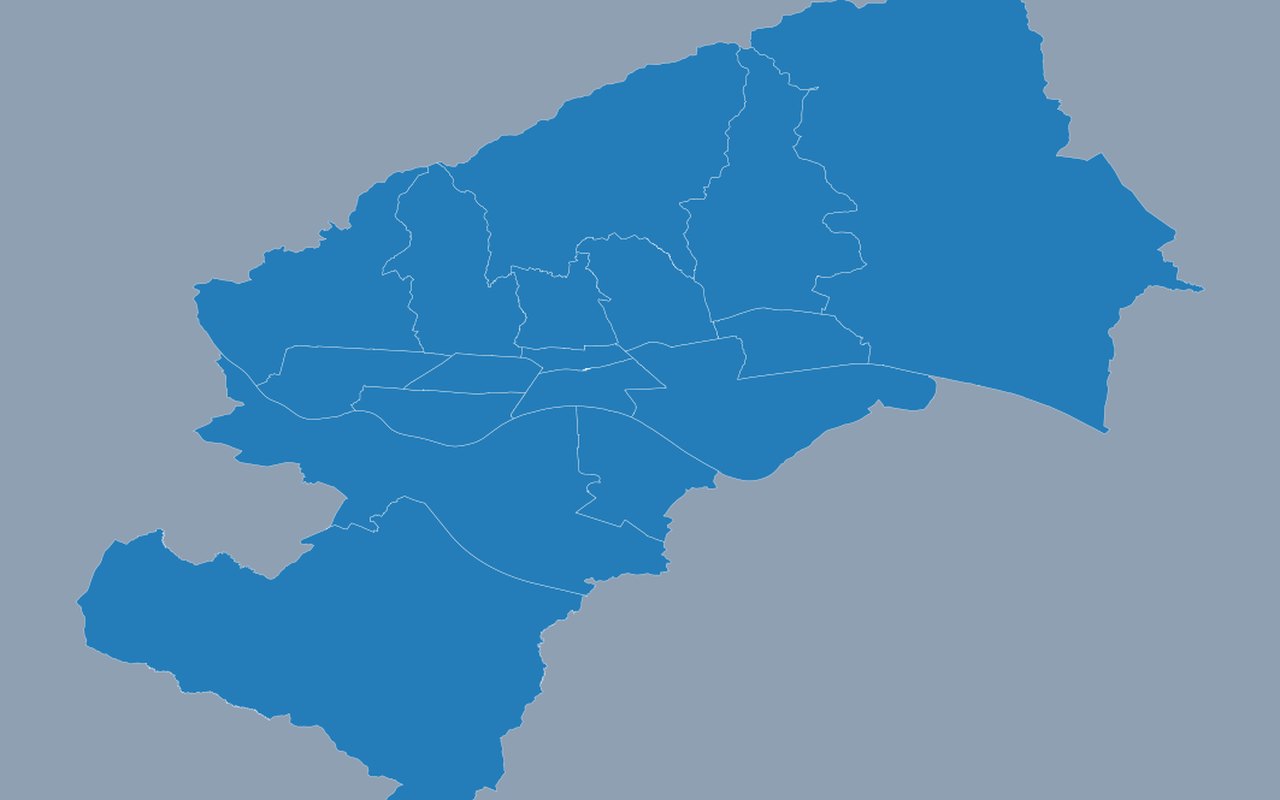
Merged boundary of the same district polygons used elsewhere on the map. City administrative boundary.
-
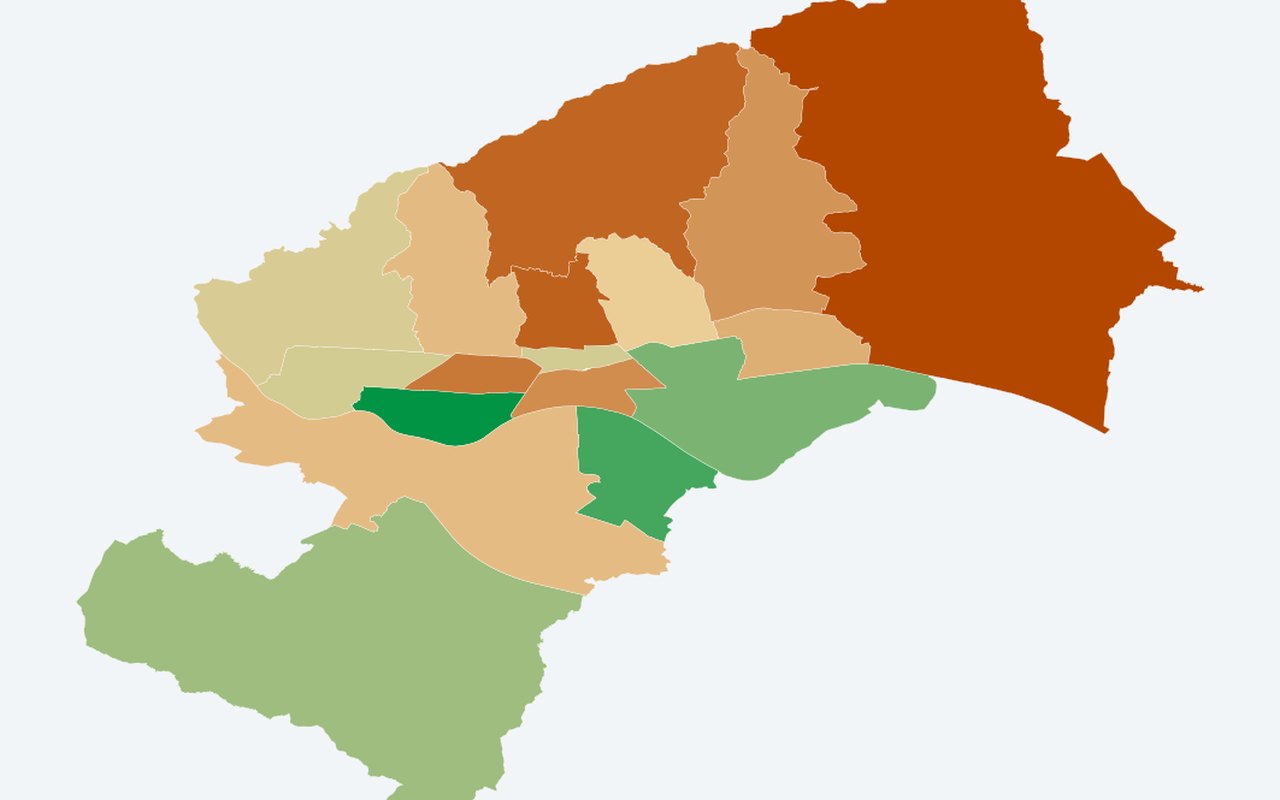
District Boundaries (Zagreb ArcGIS)
Zagreb's 17 city districts (gradske četvrti). Zagreb city district (gradska četvrt) boundaries.